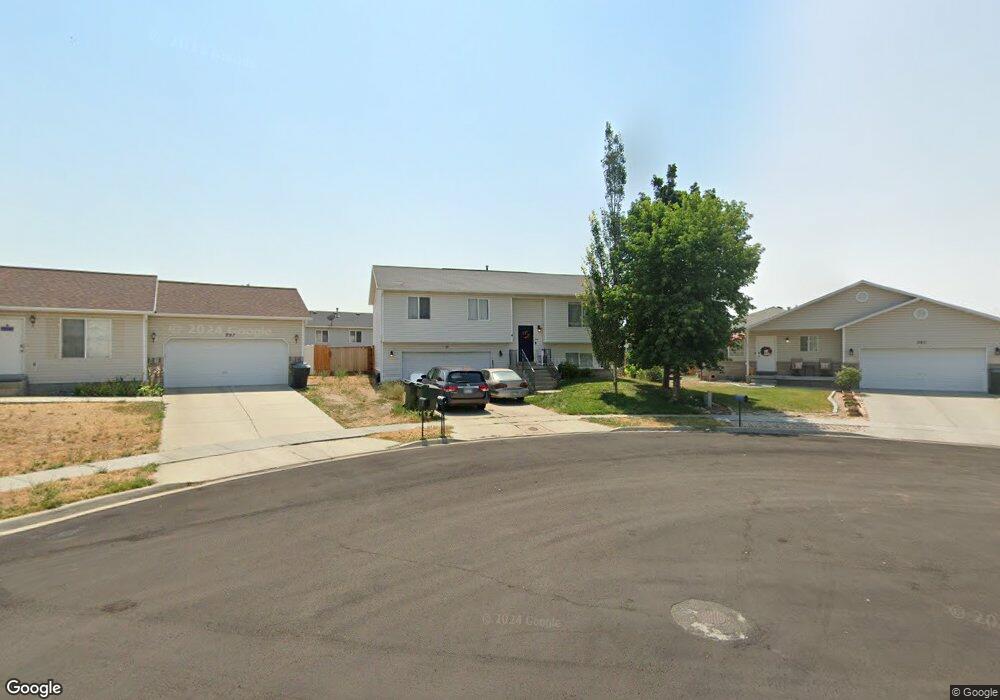
261 Wallace Way Tooele, UT 84074
Estimated Value: $376,000 - $386,000
3
Beds
2
Baths
1,723
Sq Ft
$221/Sq Ft
Est. Value
About This Home
This home is located at 261 Wallace Way, Tooele, UT 84074 and is currently estimated at $381,200, approximately $221 per square foot. 261 Wallace Way is a home located in Tooele County with nearby schools including Northlake Elementary School, Tooele Junior High School, and Tooele High School.
Ownership History
Date
Name
Owned For
Owner Type
Purchase Details
Closed on
Aug 7, 2009
Sold by
Fields Jon Alan
Bought by
Bianchard David
Current Estimated Value
Home Financials for this Owner
Home Financials are based on the most recent Mortgage that was taken out on this home.
Original Mortgage
$147,244
Outstanding Balance
$95,808
Interest Rate
5.17%
Mortgage Type
New Conventional
Estimated Equity
$285,392
Purchase Details
Closed on
Oct 26, 2005
Sold by
Millward Debbie K
Bought by
Fields Jon Alan
Home Financials for this Owner
Home Financials are based on the most recent Mortgage that was taken out on this home.
Original Mortgage
$3,763
Interest Rate
5.68%
Mortgage Type
Stand Alone Second
Purchase Details
Closed on
Jun 30, 2005
Sold by
Deatherage Brandon K and Deatherage Syndee
Bought by
Millward Debbie K
Create a Home Valuation Report for This Property
The Home Valuation Report is an in-depth analysis detailing your home's value as well as a comparison with similar homes in the area
Purchase History
| Date | Buyer | Sale Price | Title Company |
|---|---|---|---|
| Bianchard David | -- | Security Title Ins Age | |
| Fields Jon Alan | -- | B & D Title Co | |
| Millward Debbie K | -- | None Available |
Source: Public Records
Mortgage History
| Date | Status | Borrower | Loan Amount |
|---|---|---|---|
| Open | Bianchard David | $147,244 | |
| Previous Owner | Fields Jon Alan | $3,763 |
Source: Public Records
Tax History
| Year | Tax Paid | Tax Assessment Tax Assessment Total Assessment is a certain percentage of the fair market value that is determined by local assessors to be the total taxable value of land and additions on the property. | Land | Improvement |
|---|---|---|---|---|
| 2025 | $2,340 | $354,908 | $96,250 | $258,658 |
| 2024 | $2,561 | $195,445 | $52,938 | $142,507 |
| 2023 | $2,561 | $209,298 | $50,423 | $158,875 |
| 2022 | $2,452 | $210,972 | $64,543 | $146,429 |
| 2021 | $1,944 | $139,863 | $19,835 | $120,028 |
| 2020 | $1,850 | $230,913 | $36,063 | $194,850 |
| 2019 | $1,736 | $213,199 | $36,063 | $177,136 |
| 2018 | $1,568 | $182,615 | $32,500 | $150,115 |
| 2017 | $1,322 | $182,615 | $32,500 | $150,115 |
| 2016 | $889 | $72,223 | $19,250 | $52,973 |
| 2015 | $889 | $64,690 | $0 | $0 |
| 2014 | -- | $64,690 | $0 | $0 |
Source: Public Records
Map
Nearby Homes
- 277 W 670 N
- 235 Alfred Dr
- 367 W 670 N
- 344 W 630 N Unit 13
- 344 W 630 N
- 312 W Sapphire Dr
- 354 W 630 N
- 354 W 630 N Unit 12
- 374 W 630 North St Unit 10
- 343 W 630 North St Unit 18
- 374 W 630 N
- 409 W Sapphire Dr Unit 7040
- 182 Alfred Dr
- 332 W 600 N Unit 46
- 342 W 600 N Unit 45
- 412 W Sapphire Dr Unit 7009
- 429 W Sapphire Dr Unit 7038
- 294 W Quartz Rd
- 443 W Sapphire Dr Unit 7036
- Snowbird Plan at Vista Meadows