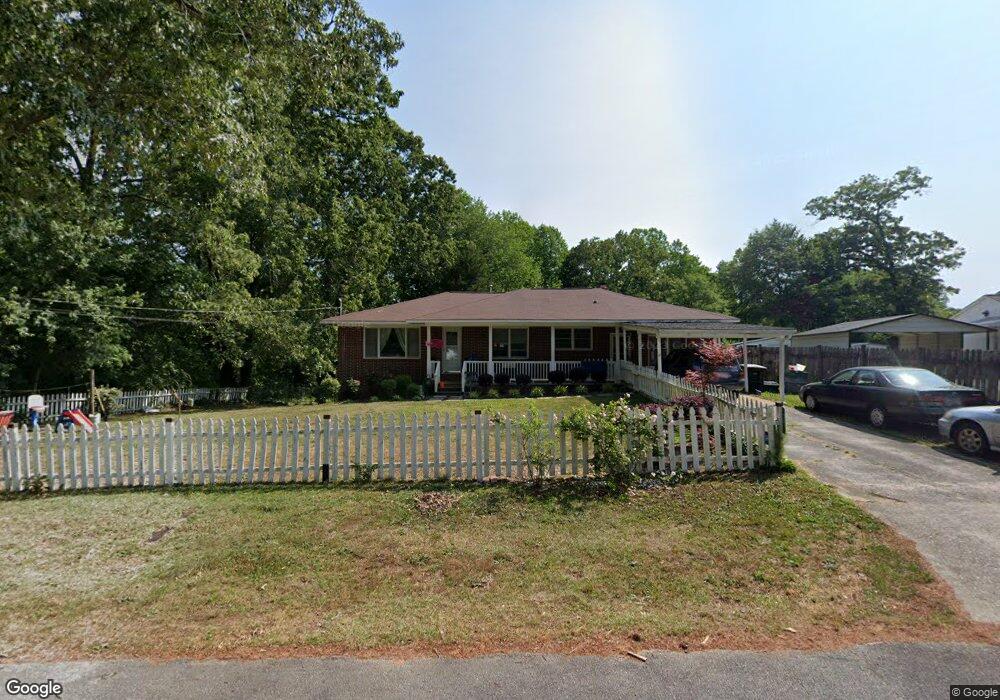
261 Woodlawn Dr Toccoa, GA 30577
Estimated Value: $184,000 - $252,000
3
Beds
2
Baths
1,497
Sq Ft
$141/Sq Ft
Est. Value
About This Home
This home is located at 261 Woodlawn Dr, Toccoa, GA 30577 and is currently estimated at $211,816, approximately $141 per square foot. 261 Woodlawn Dr is a home located in Stephens County with nearby schools including Stephens County High School.
Ownership History
Date
Name
Owned For
Owner Type
Purchase Details
Closed on
Dec 18, 2017
Sold by
Demmler Derek J
Bought by
Leviner Kaitlyn Nicole
Current Estimated Value
Home Financials for this Owner
Home Financials are based on the most recent Mortgage that was taken out on this home.
Original Mortgage
$97,294
Outstanding Balance
$82,187
Interest Rate
4.25%
Mortgage Type
FHA
Estimated Equity
$129,629
Purchase Details
Closed on
May 5, 2011
Sold by
Clark Bernell
Bought by
Demmler Mary R
Home Financials for this Owner
Home Financials are based on the most recent Mortgage that was taken out on this home.
Original Mortgage
$59,500
Interest Rate
4.85%
Mortgage Type
New Conventional
Purchase Details
Closed on
Feb 16, 2007
Sold by
Tubbs George W
Bought by
Clark Charles G
Purchase Details
Closed on
Jul 1, 1987
Bought by
<Buyer Info Not Present>
Create a Home Valuation Report for This Property
The Home Valuation Report is an in-depth analysis detailing your home's value as well as a comparison with similar homes in the area
Home Values in the Area
Average Home Value in this Area
Purchase History
| Date | Buyer | Sale Price | Title Company |
|---|---|---|---|
| Leviner Kaitlyn Nicole | $99,090 | -- | |
| Demmler Mary R | $70,000 | -- | |
| Clark Charles G | $87,000 | -- | |
| <Buyer Info Not Present> | $32,000 | -- |
Source: Public Records
Mortgage History
| Date | Status | Borrower | Loan Amount |
|---|---|---|---|
| Open | Leviner Kaitlyn Nicole | $97,294 | |
| Previous Owner | Demmler Mary R | $59,500 |
Source: Public Records
Tax History Compared to Growth
Tax History
| Year | Tax Paid | Tax Assessment Tax Assessment Total Assessment is a certain percentage of the fair market value that is determined by local assessors to be the total taxable value of land and additions on the property. | Land | Improvement |
|---|---|---|---|---|
| 2025 | $1,633 | $55,005 | $3,775 | $51,230 |
| 2024 | $1,375 | $38,572 | $3,775 | $34,797 |
| 2023 | $1,282 | $36,233 | $3,775 | $32,458 |
| 2022 | $1,034 | $34,747 | $3,775 | $30,972 |
| 2021 | $1,017 | $32,525 | $3,775 | $28,750 |
| 2020 | $1,018 | $32,248 | $3,775 | $28,473 |
| 2019 | $1,020 | $32,162 | $3,794 | $28,368 |
| 2018 | $1,020 | $32,162 | $3,794 | $28,368 |
| 2017 | $861 | $28,726 | $3,794 | $24,932 |
| 2016 | $847 | $28,726 | $3,794 | $24,931 |
| 2015 | $889 | $28,783 | $3,794 | $24,989 |
| 2014 | $899 | $28,634 | $3,794 | $24,840 |
| 2013 | -- | $28,634 | $3,794 | $24,840 |
Source: Public Records
Map
Nearby Homes
- 0 Moreland Dr Unit 10565201
- 148 Moreland Dr
- 1222 E Tugalo St
- 139 Myrtle St
- 999 E Doyle St
- 1499 E Tugalo St
- 45 Hayes St
- 43 Mountain View Dr
- 0 Hillendale Dr Unit 7660500
- 0 Hillendale Dr Unit 10618602
- 0 Hwy 17 Alt Unit 10577119
- 110 Valley Rd
- 171 Quail Forest Cir
- 1168 Rosedale St
- 297 Ayers Creek Dr
- 327 Ayers Creek Dr
- 405 Ayers Creek Dr
- 43 Pauline St
- 117 Glencrest Dr
- 84 Oak Creek Cir
- 91 Ridge Rd
- 267 Woodlawn Dr
- 209 Woodlawn Dr
- 242 Woodlawn Dr
- 106 Ridge Rd
- 71 Ridge Rd
- 278 Woodlawn Dr
- 297 Woodlawn Dr
- 0 Woodlawn Dr Unit 8712324
- 0 Woodlawn Dr Unit 8577480
- 53 Ridge Rd
- 114 Morland Dr
- 343 Woodlawn Dr
- 110 Morland Dr
- 0 Ridge Rd Unit 2892855
- 0000 Ridge Rd
- 0 Ridge Rd Unit 4082350
- 342 Woodlawn Dr
- 327 Woodlawn Dr
- 328 Woodlawn Dr