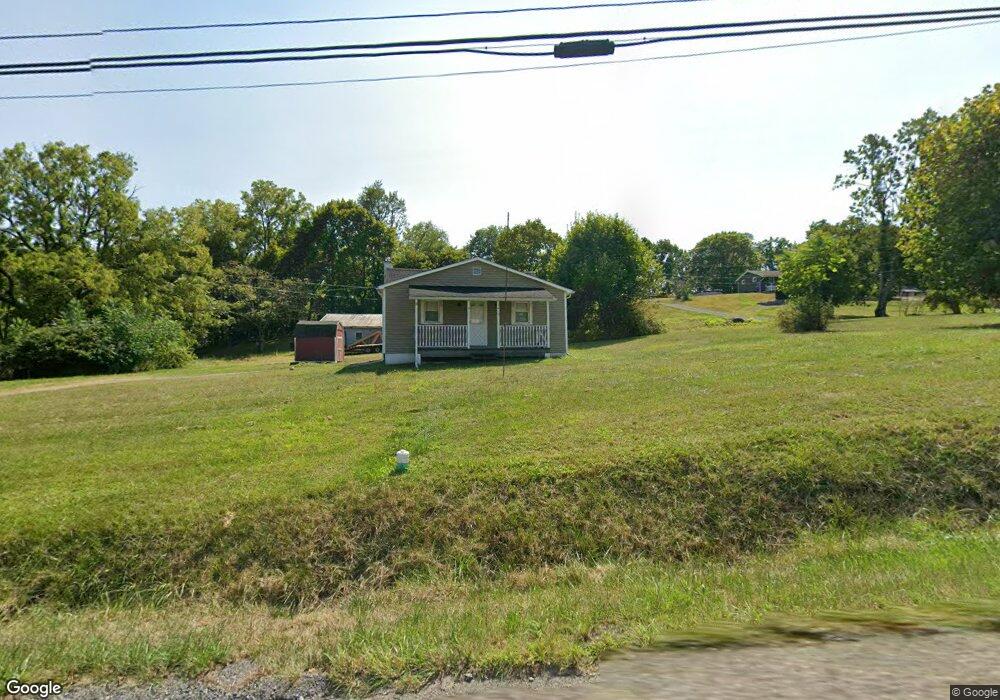
2610 Bloom Rd Danville, PA 17821
Estimated Value: $152,000 - $214,000
2
Beds
1
Bath
780
Sq Ft
$230/Sq Ft
Est. Value
About This Home
This home is located at 2610 Bloom Rd, Danville, PA 17821 and is currently estimated at $179,314, approximately $229 per square foot. 2610 Bloom Rd is a home located in Montour County with nearby schools including Danville Primary School, Liberty-Valley Elementary School, and Danville Area Middle School.
Ownership History
Date
Name
Owned For
Owner Type
Purchase Details
Closed on
May 4, 2012
Sold by
Watson Jeffrey R
Bought by
Watson Jeffrey R and The Jeffrey R Watson Living Trust
Current Estimated Value
Home Financials for this Owner
Home Financials are based on the most recent Mortgage that was taken out on this home.
Original Mortgage
$87,000
Outstanding Balance
$60,588
Interest Rate
4.01%
Mortgage Type
Credit Line Revolving
Estimated Equity
$118,726
Create a Home Valuation Report for This Property
The Home Valuation Report is an in-depth analysis detailing your home's value as well as a comparison with similar homes in the area
Home Values in the Area
Average Home Value in this Area
Purchase History
| Date | Buyer | Sale Price | Title Company |
|---|---|---|---|
| Watson Jeffrey R | -- | None Available |
Source: Public Records
Mortgage History
| Date | Status | Borrower | Loan Amount |
|---|---|---|---|
| Open | Watson Jeffrey R | $87,000 |
Source: Public Records
Tax History Compared to Growth
Tax History
| Year | Tax Paid | Tax Assessment Tax Assessment Total Assessment is a certain percentage of the fair market value that is determined by local assessors to be the total taxable value of land and additions on the property. | Land | Improvement |
|---|---|---|---|---|
| 2025 | $1,499 | $88,900 | $27,800 | $61,100 |
| 2024 | $1,447 | $88,900 | $27,800 | $61,100 |
| 2023 | $1,448 | $88,900 | $27,800 | $61,100 |
| 2022 | $1,404 | $88,900 | $27,800 | $61,100 |
| 2021 | $1,369 | $88,900 | $27,800 | $61,100 |
| 2020 | $1,357 | $88,900 | $27,800 | $61,100 |
| 2019 | $1,313 | $88,900 | $27,800 | $61,100 |
| 2018 | $1,280 | $88,900 | $27,800 | $61,100 |
| 2017 | $1,282 | $88,900 | $27,800 | $61,100 |
| 2016 | $1,275 | $88,900 | $27,800 | $61,100 |
| 2015 | $341 | $88,900 | $27,800 | $61,100 |
| 2014 | -- | $88,900 | $27,800 | $61,100 |
Source: Public Records
Map
Nearby Homes