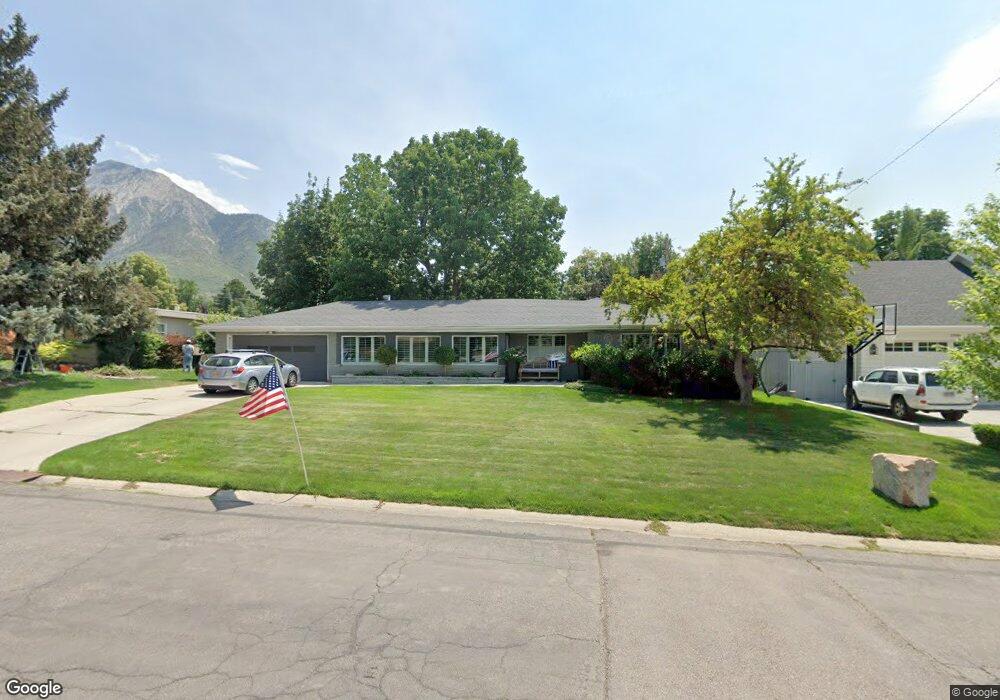
2610 E Rowland Dr Salt Lake City, UT 84124
Estimated Value: $837,266 - $1,267,000
3
Beds
2
Baths
1,843
Sq Ft
$540/Sq Ft
Est. Value
About This Home
This home is located at 2610 E Rowland Dr, Salt Lake City, UT 84124 and is currently estimated at $995,317, approximately $540 per square foot. 2610 E Rowland Dr is a home located in Salt Lake County with nearby schools including Howard R Driggs School, Olympus Junior High School, and Olympus High School.
Ownership History
Date
Name
Owned For
Owner Type
Purchase Details
Closed on
Jan 1, 2018
Sold by
Raybould John and Paulsen Lisa Ann
Bought by
The John And Kimberly Raybould Trust
Current Estimated Value
Purchase Details
Closed on
May 27, 2009
Sold by
Paulsen Lisa Ann
Bought by
Paulsen Lisa Ann and Raybould John
Home Financials for this Owner
Home Financials are based on the most recent Mortgage that was taken out on this home.
Original Mortgage
$361,334
Interest Rate
4.8%
Mortgage Type
FHA
Purchase Details
Closed on
Jul 6, 2004
Sold by
Smith Robert E and Smith Karlyn H
Bought by
Smith Robert E and Smith Karlyn
Purchase Details
Closed on
Sep 8, 1999
Sold by
Howard Roberta M and Johnson Carolyn H
Bought by
Smith Robert E and Smith Karlyn H
Home Financials for this Owner
Home Financials are based on the most recent Mortgage that was taken out on this home.
Original Mortgage
$247,000
Interest Rate
7.5%
Create a Home Valuation Report for This Property
The Home Valuation Report is an in-depth analysis detailing your home's value as well as a comparison with similar homes in the area
Home Values in the Area
Average Home Value in this Area
Purchase History
| Date | Buyer | Sale Price | Title Company |
|---|---|---|---|
| The John And Kimberly Raybould Trust | -- | None Available | |
| Paulsen Lisa Ann | -- | Accommodation | |
| Paulsen Lisa Ann | -- | Security Title Of Davis Co I | |
| Smith Robert E | -- | -- | |
| Smith Robert E | -- | First American Title Ins Co |
Source: Public Records
Mortgage History
| Date | Status | Borrower | Loan Amount |
|---|---|---|---|
| Previous Owner | Paulsen Lisa Ann | $361,334 | |
| Previous Owner | Smith Robert E | $247,000 |
Source: Public Records
Tax History Compared to Growth
Tax History
| Year | Tax Paid | Tax Assessment Tax Assessment Total Assessment is a certain percentage of the fair market value that is determined by local assessors to be the total taxable value of land and additions on the property. | Land | Improvement |
|---|---|---|---|---|
| 2025 | $3,869 | $729,300 | $347,600 | $381,700 |
| 2024 | $3,869 | $700,300 | $336,900 | $363,400 |
| 2023 | $3,586 | $632,500 | $262,800 | $369,700 |
| 2022 | $3,589 | $636,200 | $257,700 | $378,500 |
| 2021 | $3,298 | $507,700 | $221,500 | $286,200 |
| 2020 | $2,838 | $433,100 | $216,700 | $216,400 |
| 2019 | $2,721 | $404,500 | $204,500 | $200,000 |
| 2018 | $330 | $370,800 | $204,500 | $166,300 |
| 2017 | $2,320 | $352,200 | $204,500 | $147,700 |
| 2016 | $2,077 | $317,100 | $204,500 | $112,600 |
| 2015 | $2,210 | $314,700 | $219,800 | $94,900 |
| 2014 | $2,124 | $297,600 | $215,500 | $82,100 |
Source: Public Records
Map
Nearby Homes
- 4375 S 2700 E
- 4092 S 2700 E
- 2615 E Camille Cir
- 2800 E Maurice Dr
- 2415 Karren St
- 4380 S Wander Ln
- 2745 E 4510 S
- 4047 S Comet Cir
- 4470 S 2700 E
- 2752 E Wardway Dr
- 2936 E 4310 S
- 2961 E Bonnie Brae Ave
- 3982 S Saturn Dr
- 4445 S Holladay Park Ln
- 3973 S 2700 E Unit 2
- 4442 Holladay Park Ln
- 4455 Holladay Park Ln
- 2241 E Melodie Ann Way
- 2263 E 4500 S
- 2321 E John Holladay Ct
- 2610 Rowland Dr
- 2624 E Rowland Dr
- 2596 Rowland Dr
- 2624 Rowland Dr
- 2627 E Melony Dr
- 2627 Melony Dr
- 2611 E Melony Dr
- 2611 Melony Dr
- 2635 E Melony Dr
- 2635 Melony Dr
- 2615 Rowland Dr
- 2582 Rowland Dr
- 2582 E Rowland Dr
- 2595 Rowland Dr
- 2601 Melony Dr
- 2651 E Melony Dr
- 2595 E Rowland Dr
- 2640 Rowland Dr
- 2651 Melony Dr
- 4217 Coral St