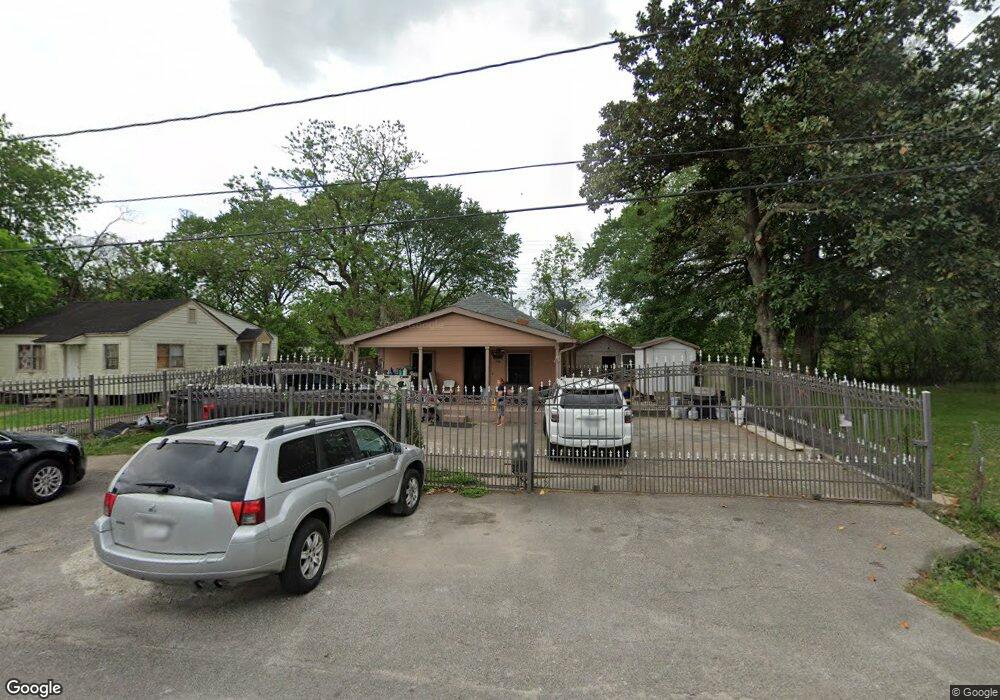
2610 Lynnfield St Houston, TX 77093
Eastex-Jensen NeighborhoodEstimated Value: $174,067 - $253,000
4
Beds
2
Baths
1,294
Sq Ft
$158/Sq Ft
Est. Value
About This Home
This home is located at 2610 Lynnfield St, Houston, TX 77093 and is currently estimated at $204,017, approximately $157 per square foot. 2610 Lynnfield St is a home located in Harris County with nearby schools including Roderick R. Paige Elementary School, Key Middle, and Kashmere High School.
Ownership History
Date
Name
Owned For
Owner Type
Purchase Details
Closed on
May 8, 2018
Sold by
Sabillon Sandra Janet and Mejia Javier
Bought by
Sabillon Sandra J Mejia
Current Estimated Value
Purchase Details
Closed on
Dec 30, 2005
Sold by
Sabillon Santos Andres and Sabillon Sandra Janet
Bought by
Sabillon Sandra Janet and Mejia Javier
Home Financials for this Owner
Home Financials are based on the most recent Mortgage that was taken out on this home.
Original Mortgage
$60,000
Outstanding Balance
$41,267
Interest Rate
10.4%
Mortgage Type
Fannie Mae Freddie Mac
Estimated Equity
$162,750
Purchase Details
Closed on
Jun 7, 2002
Sold by
Encore Interests Llc
Bought by
Savillon Santos Andres and Savillon Sandra Janet
Purchase Details
Closed on
Apr 30, 2002
Sold by
Taylor Ruth
Bought by
Encore Interests Llc
Create a Home Valuation Report for This Property
The Home Valuation Report is an in-depth analysis detailing your home's value as well as a comparison with similar homes in the area
Home Values in the Area
Average Home Value in this Area
Purchase History
| Date | Buyer | Sale Price | Title Company |
|---|---|---|---|
| Sabillon Sandra J Mejia | -- | None Available | |
| Sabillon Sandra Janet | -- | Fidelity National Title | |
| Savillon Santos Andres | -- | First Southwestern Title | |
| Encore Interests Llc | -- | First Southwestern Title Co |
Source: Public Records
Mortgage History
| Date | Status | Borrower | Loan Amount |
|---|---|---|---|
| Open | Sabillon Sandra Janet | $60,000 |
Source: Public Records
Tax History Compared to Growth
Tax History
| Year | Tax Paid | Tax Assessment Tax Assessment Total Assessment is a certain percentage of the fair market value that is determined by local assessors to be the total taxable value of land and additions on the property. | Land | Improvement |
|---|---|---|---|---|
| 2025 | $2,545 | $128,692 | $64,157 | $64,535 |
| 2024 | $2,545 | $121,622 | $53,465 | $68,157 |
| 2023 | $2,545 | $116,275 | $48,118 | $68,157 |
| 2022 | $1,991 | $90,427 | $32,079 | $58,348 |
| 2021 | $1,819 | $78,053 | $32,079 | $45,974 |
| 2020 | $1,890 | $78,053 | $32,079 | $45,974 |
| 2019 | $1,975 | $78,053 | $21,386 | $56,667 |
| 2018 | $841 | $56,193 | $21,386 | $34,807 |
| 2017 | $1,421 | $56,193 | $21,386 | $34,807 |
| 2016 | $1,295 | $51,207 | $14,257 | $36,950 |
| 2015 | $879 | $51,207 | $14,257 | $36,950 |
| 2014 | $879 | $51,207 | $14,257 | $36,950 |
Source: Public Records
Map
Nearby Homes
- 2707 Lynnfield St
- 2710 Lynnfield St
- 2503 Creston Dr
- 4008 Bennington St
- 2513 Melbourne St
- 6806 Schuller Rd
- 2301 King St
- 2314 Spence St
- 2402 Bennington St
- 2507 Creston Dr
- 3016 King St
- 2015 Creston Dr
- 3012 Melbourne St
- 2301 Caplin St
- 3224 Creston Dr
- 3206 Melbourne St
- 7307 Adelbert St
- 3210 Oklahoma St
- 2120 Vance St
- 7305 Jensen
- 2614 Lynnfield St
- 2602 Lynnfield St
- 2702 Lynnfield St
- 2609 Lynnfield St
- 2605 Lynnfield St
- 2613 Lynnfield St
- 2601 Lynnfield St
- 2528 Lynnfield St
- 2615 Creston Dr
- 2615 Creston Dr Unit 1
- 2613 Creston Dr
- 2709 Lynnfield St
- 2527 Lynnfield St
- 2610 Spence St
- 2703 Creston Dr
- 2614 Spence St
- 2606 Spence St
- 2601 Creston Dr
- 2526 Lynnfield St
- 2702 Spence St