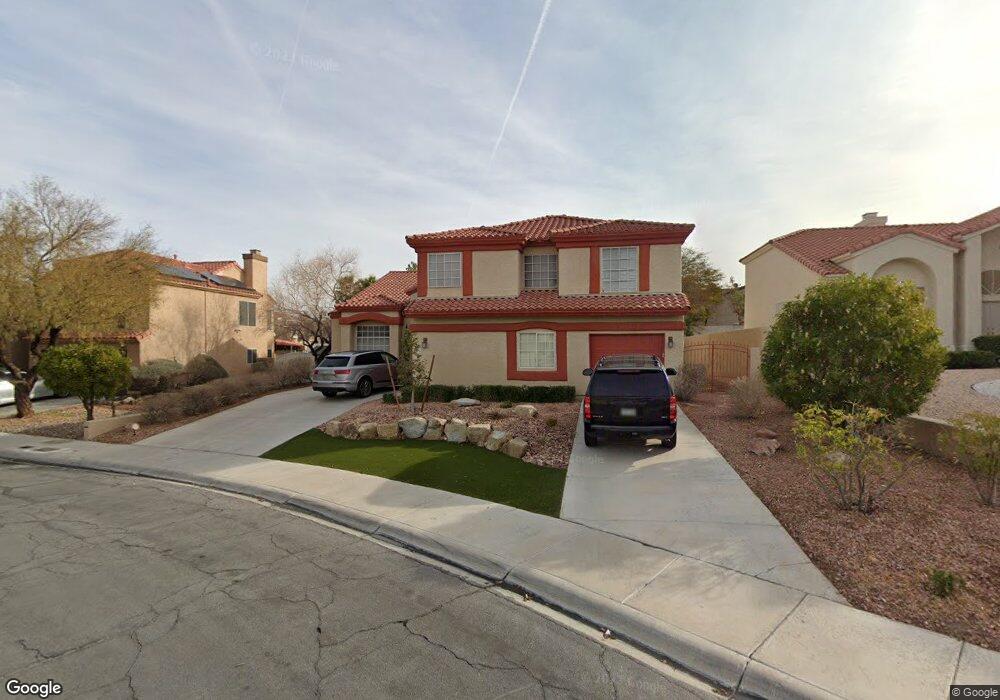
2610 Orchard Meadows Ave Henderson, NV 89074
Green Valley South NeighborhoodEstimated Value: $341,000 - $356,000
3
Beds
3
Baths
1,523
Sq Ft
$230/Sq Ft
Est. Value
About This Home
This home is located at 2610 Orchard Meadows Ave, Henderson, NV 89074 and is currently estimated at $349,888, approximately $229 per square foot. 2610 Orchard Meadows Ave is a home located in Clark County with nearby schools including Aggie Roberts Elementary School, Jack Lund Schofield Middle School, and Silverado High School.
Ownership History
Date
Name
Owned For
Owner Type
Purchase Details
Closed on
Jun 22, 2001
Sold by
Zimmerman John M and Zimmerman Debra M
Bought by
Nicolas Wendy C
Current Estimated Value
Home Financials for this Owner
Home Financials are based on the most recent Mortgage that was taken out on this home.
Original Mortgage
$122,902
Outstanding Balance
$46,816
Interest Rate
7.14%
Mortgage Type
FHA
Estimated Equity
$303,072
Purchase Details
Closed on
Apr 5, 1996
Sold by
Zimmerman John M and Bull Catherine M
Bought by
Zimmerman John M and Zimmerman Debra M
Purchase Details
Closed on
Feb 7, 1996
Sold by
Zimmerman Debra M
Bought by
Zimmerman John M
Purchase Details
Closed on
Nov 21, 1995
Sold by
Collins Brothers Corp
Bought by
Zimmerman John M and Bull Catherine M
Home Financials for this Owner
Home Financials are based on the most recent Mortgage that was taken out on this home.
Original Mortgage
$107,771
Interest Rate
7.1%
Mortgage Type
FHA
Create a Home Valuation Report for This Property
The Home Valuation Report is an in-depth analysis detailing your home's value as well as a comparison with similar homes in the area
Home Values in the Area
Average Home Value in this Area
Purchase History
| Date | Buyer | Sale Price | Title Company |
|---|---|---|---|
| Nicolas Wendy C | $124,000 | Nevada Title Company | |
| Zimmerman John M | -- | United Title | |
| Zimmerman John M | -- | Lawyers Title | |
| Zimmerman John M | $108,000 | Lawyers Title |
Source: Public Records
Mortgage History
| Date | Status | Borrower | Loan Amount |
|---|---|---|---|
| Open | Nicolas Wendy C | $122,902 | |
| Previous Owner | Zimmerman John M | $107,771 |
Source: Public Records
Tax History Compared to Growth
Tax History
| Year | Tax Paid | Tax Assessment Tax Assessment Total Assessment is a certain percentage of the fair market value that is determined by local assessors to be the total taxable value of land and additions on the property. | Land | Improvement |
|---|---|---|---|---|
| 2025 | $1,207 | $75,896 | $26,600 | $49,296 |
| 2024 | $1,172 | $75,896 | $26,600 | $49,296 |
| 2023 | $1,172 | $70,694 | $25,550 | $45,144 |
| 2022 | $1,138 | $63,972 | $21,000 | $42,972 |
| 2021 | $1,105 | $56,072 | $21,000 | $35,072 |
| 2020 | $1,070 | $55,584 | $18,900 | $36,684 |
| 2019 | $1,039 | $52,595 | $16,100 | $36,495 |
| 2018 | $1,009 | $47,566 | $12,600 | $34,966 |
| 2017 | $1,352 | $46,223 | $11,550 | $34,673 |
| 2016 | $956 | $43,385 | $8,750 | $34,635 |
| 2015 | $953 | $33,821 | $5,950 | $27,871 |
| 2014 | $925 | $32,012 | $5,250 | $26,762 |
Source: Public Records
Map
Nearby Homes
- 27 Bishopsgate Terrace
- 37 Bishopsgate Terrace
- 2476 Via de Milano
- 21 Megan Dr Unit 3
- 2510 Furnace Creek Ave
- 9024 Trombone Ln
- 36 Tidwell Ln
- 2505 Cortina Ave
- 16 Old Lake Cir
- 20 Avenida Picasso
- 112 Wynntry Dr
- 43 Fantasia Ln
- 126 Montclair Dr
- 2439 Avenida Flores
- 2802 Camelback Ln
- 124 Tapatio St
- 2420 Pebble Springs Ct
- 137 Wynntry Dr
- 2458 Tour Edition Dr
- 2427 Worchester Rd
- 2608 Orchard Meadows Ave Unit 2608
- 2608 Orchard Meadows Ave
- 2608 Orchard Meadows Ave Unit na
- 2611 Country Maple Ave
- 2609 Country Maple Ave
- 2606 Orchard Meadows Ave
- 2611 Orchard Meadows Ave
- 2607 Country Maple Ave
- 2607 Orchard Meadows Ave
- 2604 Orchard Meadows Ave
- 28 Stone Cress Dr
- 26 Stone Cress Dr
- 2605 Country Maple Ave
- 2610 Country Maple Ave
- 2610 Smoke Canyon Ave
- 2608 Country Maple Ave
- 2605 Orchard Meadows Ave
- 2608 Smoke Canyon Ave
- 2606 Country Maple Ave
- 2606 Country Maple Ave Unit n/a