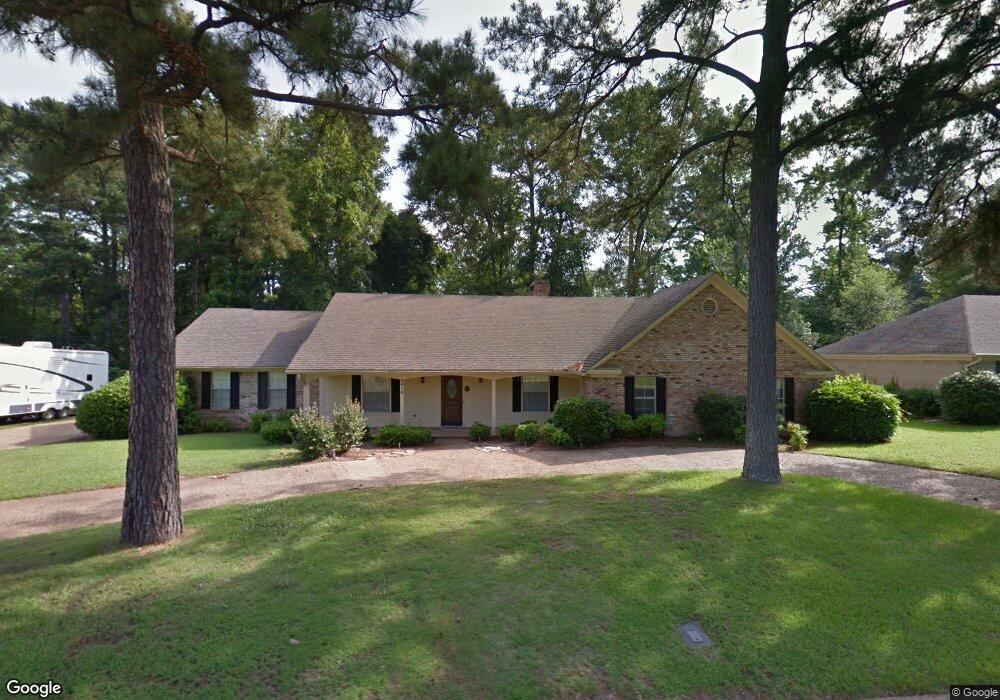
2610 Regency Magnolia, AR 71753
Estimated Value: $298,000 - $331,000
--
Bed
3
Baths
2,717
Sq Ft
$114/Sq Ft
Est. Value
About This Home
This home is located at 2610 Regency, Magnolia, AR 71753 and is currently estimated at $309,918, approximately $114 per square foot. 2610 Regency is a home located in Columbia County with nearby schools including East Side Elementary School, Central Elementary School, and Magnolia Junior High School.
Ownership History
Date
Name
Owned For
Owner Type
Purchase Details
Closed on
Sep 1, 2021
Sold by
Raines Jeremy Edzard and Raines Lindsey Nacole
Bought by
Torres Marcos Antonia and Torres Sydnee Michelle
Current Estimated Value
Home Financials for this Owner
Home Financials are based on the most recent Mortgage that was taken out on this home.
Original Mortgage
$260,988
Outstanding Balance
$236,600
Interest Rate
2.7%
Mortgage Type
FHA
Estimated Equity
$73,318
Purchase Details
Closed on
Jun 4, 2014
Bought by
Raines Edzard and Raines Lindsey Nacole
Home Financials for this Owner
Home Financials are based on the most recent Mortgage that was taken out on this home.
Original Mortgage
$211,688
Interest Rate
4.27%
Mortgage Type
Stand Alone Refi Refinance Of Original Loan
Purchase Details
Closed on
Sep 27, 2012
Sold by
Goodwin John Andrew and Goodwin Debra Jean
Bought by
Jrb Investments Llc
Purchase Details
Closed on
Jul 1, 2012
Sold by
Goodwin Michael Dudney and Goodwin John Andrew
Bought by
Goodwin John Andrew
Create a Home Valuation Report for This Property
The Home Valuation Report is an in-depth analysis detailing your home's value as well as a comparison with similar homes in the area
Home Values in the Area
Average Home Value in this Area
Purchase History
| Date | Buyer | Sale Price | Title Company |
|---|---|---|---|
| Torres Marcos Antonia | $270,000 | None Available | |
| Raines Edzard | -- | -- | |
| Jrb Investments Llc | -- | -- | |
| Goodwin John Andrew | -- | -- |
Source: Public Records
Mortgage History
| Date | Status | Borrower | Loan Amount |
|---|---|---|---|
| Open | Torres Marcos Antonia | $260,988 | |
| Previous Owner | Raines Edzard | $211,688 | |
| Closed | Jrb Investments Llc | $0 |
Source: Public Records
Tax History Compared to Growth
Tax History
| Year | Tax Paid | Tax Assessment Tax Assessment Total Assessment is a certain percentage of the fair market value that is determined by local assessors to be the total taxable value of land and additions on the property. | Land | Improvement |
|---|---|---|---|---|
| 2025 | $2,497 | $55,611 | $4,000 | $51,611 |
| 2024 | $2,102 | $55,611 | $4,000 | $51,611 |
| 2023 | $1,830 | $48,260 | $4,000 | $44,260 |
| 2022 | $1,797 | $48,260 | $4,000 | $44,260 |
| 2021 | $1,747 | $48,260 | $4,000 | $44,260 |
| 2020 | $1,830 | $48,260 | $4,000 | $44,260 |
| 2019 | $1,856 | $48,260 | $4,000 | $44,260 |
| 2018 | $1,570 | $48,260 | $4,000 | $44,260 |
| 2017 | $1,591 | $40,180 | $4,000 | $36,180 |
| 2016 | -- | $40,180 | $4,000 | $36,180 |
| 2015 | -- | $40,180 | $4,000 | $36,180 |
| 2013 | -- | $0 | $0 | $0 |
Source: Public Records
Map
Nearby Homes
- 2604 Fox Run
- 2518 Chaffin Ln Unit Lot 5,Block 2
- 00 Regency Cir
- 1604 Karen Cir
- 2518 Cherokee Dr
- 6 Tanglewood
- 1615 Karen Cir
- 0 Regency Cir
- 13 Tanglewood
- 2407 Chaffin Ln
- 00 U S Highway 82
- 1309 Bluebird Hill Dr
- 2 Azalea
- 100 Deer Crossing Dr
- 1221 Bluebird Hill Dr
- 10 Azalea
- 2104 N Dudney Rd
- 23 Woodlawn Dr
- 1819 Gean
- 41 Azalea