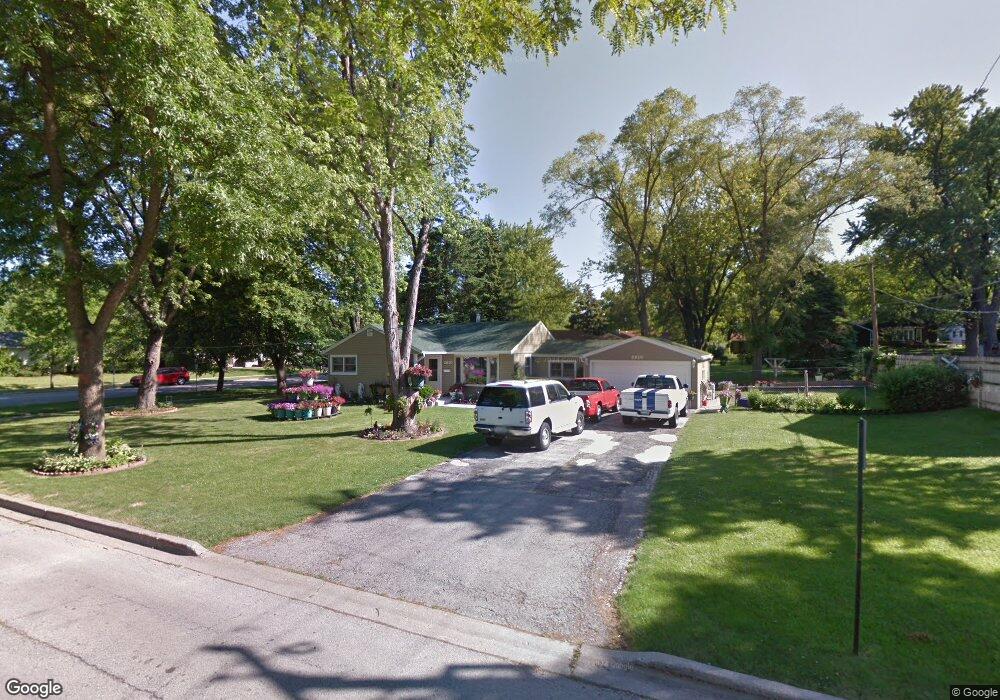
2610 South St Rolling Meadows, IL 60008
Estimated Value: $330,000 - $349,000
3
Beds
2
Baths
1,003
Sq Ft
$335/Sq Ft
Est. Value
About This Home
This home is located at 2610 South St, Rolling Meadows, IL 60008 and is currently estimated at $336,430, approximately $335 per square foot. 2610 South St is a home located in Cook County with nearby schools including Kimball Hill Elementary School, Carl Sandburg Junior High School, and Rolling Meadows High School.
Ownership History
Date
Name
Owned For
Owner Type
Purchase Details
Closed on
Oct 6, 2002
Sold by
Carrillo Filemon and Felix Maria
Bought by
Carrillo Filemon
Current Estimated Value
Home Financials for this Owner
Home Financials are based on the most recent Mortgage that was taken out on this home.
Original Mortgage
$159,200
Interest Rate
6.18%
Purchase Details
Closed on
Jul 29, 1999
Sold by
Dunphy Joseph R and Dunphy Myrna P
Bought by
Carrillo Filemon and Felix Maria
Home Financials for this Owner
Home Financials are based on the most recent Mortgage that was taken out on this home.
Original Mortgage
$155,617
Interest Rate
7.69%
Mortgage Type
FHA
Create a Home Valuation Report for This Property
The Home Valuation Report is an in-depth analysis detailing your home's value as well as a comparison with similar homes in the area
Home Values in the Area
Average Home Value in this Area
Purchase History
| Date | Buyer | Sale Price | Title Company |
|---|---|---|---|
| Carrillo Filemon | -- | -- | |
| Carrillo Filemon | $157,000 | -- |
Source: Public Records
Mortgage History
| Date | Status | Borrower | Loan Amount |
|---|---|---|---|
| Closed | Carrillo Filemon | $159,200 | |
| Closed | Carrillo Filemon | $155,617 |
Source: Public Records
Tax History
| Year | Tax Paid | Tax Assessment Tax Assessment Total Assessment is a certain percentage of the fair market value that is determined by local assessors to be the total taxable value of land and additions on the property. | Land | Improvement |
|---|---|---|---|---|
| 2025 | $6,952 | $30,000 | $6,893 | $23,107 |
| 2024 | $6,952 | $26,000 | $5,833 | $20,167 |
| 2023 | $6,627 | $26,000 | $5,833 | $20,167 |
| 2022 | $6,627 | $26,000 | $5,833 | $20,167 |
| 2021 | $5,340 | $19,456 | $3,446 | $16,010 |
| 2020 | $5,288 | $19,456 | $3,446 | $16,010 |
| 2019 | $5,327 | $21,739 | $3,446 | $18,293 |
| 2018 | $4,800 | $18,255 | $3,181 | $15,074 |
| 2017 | $4,721 | $18,255 | $3,181 | $15,074 |
| 2016 | $4,658 | $18,255 | $3,181 | $15,074 |
| 2015 | $3,886 | $14,967 | $2,916 | $12,051 |
| 2014 | $3,811 | $14,967 | $2,916 | $12,051 |
| 2013 | $3,701 | $14,967 | $2,916 | $12,051 |
Source: Public Records
Map
Nearby Homes
- 2705 Park St
- 2503 George St
- 2709 Lily Ln
- 3100 Town Square Dr Unit 308
- 3100 Town Square Dr Unit 204
- 2308 Park St
- 2814 Cardinal Dr
- 3135 Town Square Dr Unit 401
- 3265 Kirchoff Rd Unit 116
- 2201 Kingfisher Ln
- 3200 Thrush Ln
- 2302 Flicker Ln
- 3107 Falcon Ct W
- 1419 W Miner St
- 2401 Rohlwing Rd
- 3800 Ashley Ct
- 3806 Ashley Ct
- 1605 W Fremont St
- 1505 W Euclid Ave
- 399 Knollwood Ct
Your Personal Tour Guide
Ask me questions while you tour the home.