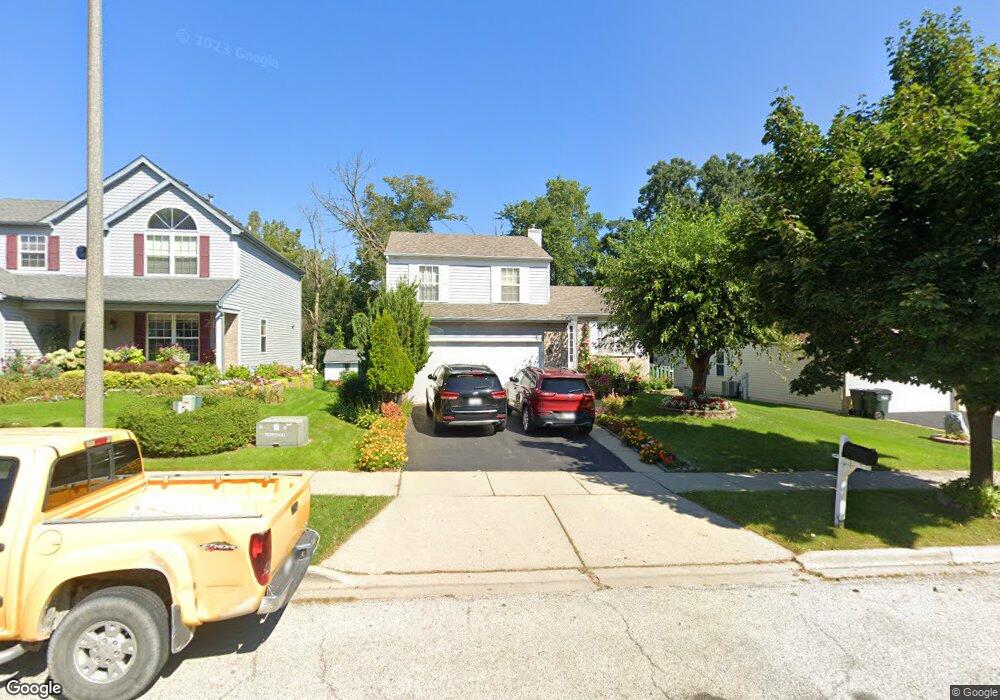
2610 Sycamore Dr Waukegan, IL 60085
Estimated Value: $289,342 - $366,000
3
Beds
2
Baths
1,460
Sq Ft
$221/Sq Ft
Est. Value
About This Home
This home is located at 2610 Sycamore Dr, Waukegan, IL 60085 and is currently estimated at $322,836, approximately $221 per square foot. 2610 Sycamore Dr is a home located in Lake County with nearby schools including Glenwood Elementary School, Miguel Juarez Middle School, and Waukegan High School.
Ownership History
Date
Name
Owned For
Owner Type
Purchase Details
Closed on
Apr 21, 2008
Sold by
Sanchez Cesar O and Romero Rebecca
Bought by
Rodriguez Dimas and Rodriguez Olivia
Current Estimated Value
Home Financials for this Owner
Home Financials are based on the most recent Mortgage that was taken out on this home.
Original Mortgage
$190,000
Outstanding Balance
$120,106
Interest Rate
5.93%
Mortgage Type
Unknown
Estimated Equity
$202,730
Purchase Details
Closed on
Mar 29, 2001
Sold by
Ochoa Juan J and Ochoa Michelle L
Bought by
Sanchez Cesar O and Romero Rebecca
Home Financials for this Owner
Home Financials are based on the most recent Mortgage that was taken out on this home.
Original Mortgage
$153,468
Interest Rate
7.13%
Mortgage Type
FHA
Purchase Details
Closed on
Jun 14, 1994
Sold by
Parkway Bank & Trust Company
Bought by
Ochoa Juan J and Ochoa Michelle L
Home Financials for this Owner
Home Financials are based on the most recent Mortgage that was taken out on this home.
Original Mortgage
$117,300
Interest Rate
8.38%
Create a Home Valuation Report for This Property
The Home Valuation Report is an in-depth analysis detailing your home's value as well as a comparison with similar homes in the area
Home Values in the Area
Average Home Value in this Area
Purchase History
| Date | Buyer | Sale Price | Title Company |
|---|---|---|---|
| Rodriguez Dimas | $200,000 | St | |
| Sanchez Cesar O | $156,000 | Chicago Title Insurance Co | |
| Ochoa Juan J | $123,500 | Chicago Title Insurance Co |
Source: Public Records
Mortgage History
| Date | Status | Borrower | Loan Amount |
|---|---|---|---|
| Open | Rodriguez Dimas | $190,000 | |
| Previous Owner | Sanchez Cesar O | $153,468 | |
| Previous Owner | Ochoa Juan J | $117,300 |
Source: Public Records
Tax History Compared to Growth
Tax History
| Year | Tax Paid | Tax Assessment Tax Assessment Total Assessment is a certain percentage of the fair market value that is determined by local assessors to be the total taxable value of land and additions on the property. | Land | Improvement |
|---|---|---|---|---|
| 2024 | $4,842 | $76,679 | $14,286 | $62,393 |
| 2023 | $5,517 | $67,350 | $12,555 | $54,795 |
| 2022 | $5,517 | $62,429 | $11,826 | $50,603 |
| 2021 | $5,195 | $55,830 | $10,548 | $45,282 |
| 2020 | $5,216 | $52,013 | $9,827 | $42,186 |
| 2019 | $5,197 | $47,662 | $9,005 | $38,657 |
| 2018 | $5,736 | $50,749 | $13,136 | $37,613 |
| 2017 | $5,533 | $44,899 | $11,622 | $33,277 |
| 2016 | $4,505 | $35,150 | $9,099 | $26,051 |
| 2015 | $4,301 | $31,460 | $8,144 | $23,316 |
| 2014 | $3,860 | $28,353 | $7,284 | $21,069 |
| 2012 | $5,004 | $30,717 | $7,891 | $22,826 |
Source: Public Records
Map
Nearby Homes
- 2813 Theresa Ave
- 12352 W Atlantic Ave
- 2810 W Atlantic Ave
- 2715 W Greenwood Ave
- 2009 Harding Ave
- 2207 Williamsburg Dr
- 2008 Harding Ave
- 2440 W Cheyenne Rd
- 1913 Chippewa Rd
- 1005 N Lewis Ave
- 1023 N Elmwood Ave
- 1038 Indiana Ave
- 2928 W Country Club Ave
- 3000 W Country Club Ave
- 2946 W Country Club Ave
- 1117 Judge Ave
- 615 Tiffany Dr
- 1213 Grand Ave
- 968 Judge Ave
- 12698 W Grandview Ave
- 2606 Sycamore Dr
- 2614 Sycamore Dr
- 2620 Sycamore Dr
- 2602 Sycamore Dr
- 2624 Sycamore Dr
- 2611 Sycamore Dr
- 2615 Sycamore Dr
- 2621 Peppertree Ln
- 2603 Sycamore Dr
- 2619 Sycamore Dr
- 2628 Sycamore Dr
- 2617 Peppertree Ln
- 2623 Sycamore Dr
- 2625 Peppertree Ln
- 2632 Sycamore Dr
- 1413 N Mcaree Rd
- 2627 Sycamore Dr
- 2524 Berry Ct
- 2618 Theresa Ave
- 2606 Theresa Ave