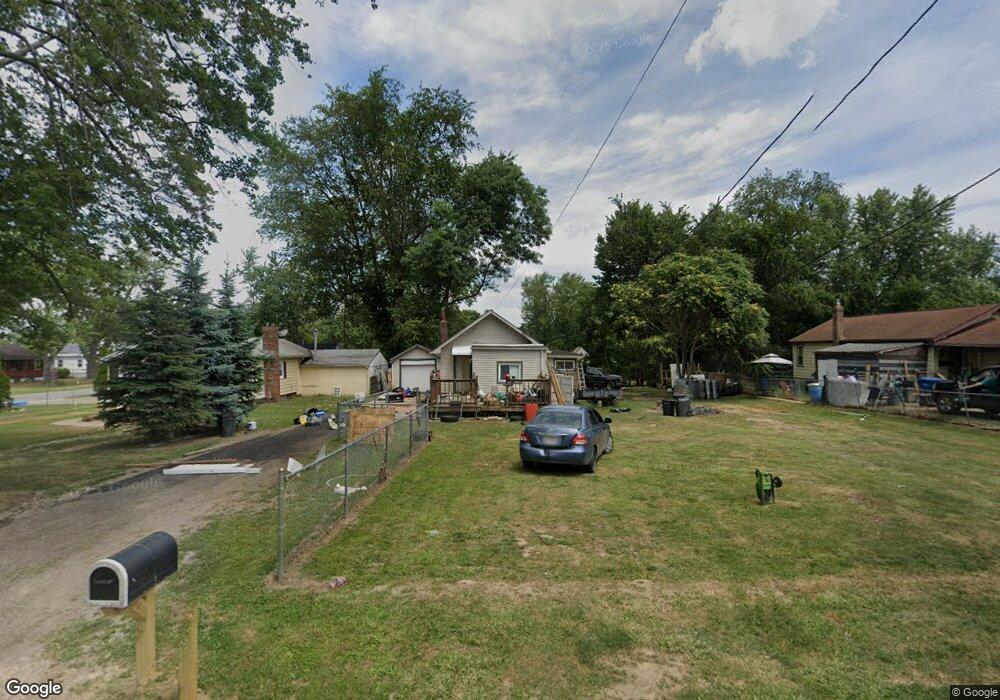
2611 31st St NE Canton, OH 44705
Fairmount NeighborhoodEstimated Value: $61,000 - $103,000
2
Beds
1
Bath
763
Sq Ft
$113/Sq Ft
Est. Value
About This Home
This home is located at 2611 31st St NE, Canton, OH 44705 and is currently estimated at $85,912, approximately $112 per square foot. 2611 31st St NE is a home located in Stark County with nearby schools including Ransom H. Barr Elementary School, Glenwood Intermediate School, and GlenOak High School.
Ownership History
Date
Name
Owned For
Owner Type
Purchase Details
Closed on
Sep 9, 2021
Sold by
Schilling Charles and Schilling Allison
Bought by
Nicewarner Laura
Current Estimated Value
Purchase Details
Closed on
May 19, 1999
Sold by
Schilling Charles R and Schilling Barbara J
Bought by
Schilling Charles
Purchase Details
Closed on
Apr 10, 1999
Sold by
Loar Randy R
Bought by
Schilling Barbara J
Purchase Details
Closed on
Aug 23, 1991
Create a Home Valuation Report for This Property
The Home Valuation Report is an in-depth analysis detailing your home's value as well as a comparison with similar homes in the area
Home Values in the Area
Average Home Value in this Area
Purchase History
| Date | Buyer | Sale Price | Title Company |
|---|---|---|---|
| Nicewarner Laura | $30,000 | None Available | |
| Schilling Charles | -- | -- | |
| Schilling Barbara J | $16,000 | -- | |
| -- | -- | -- |
Source: Public Records
Tax History Compared to Growth
Tax History
| Year | Tax Paid | Tax Assessment Tax Assessment Total Assessment is a certain percentage of the fair market value that is determined by local assessors to be the total taxable value of land and additions on the property. | Land | Improvement |
|---|---|---|---|---|
| 2025 | $455 | $20,690 | $6,790 | $13,900 |
| 2024 | $370 | $20,690 | $6,790 | $13,900 |
| 2023 | $1,047 | $13,730 | $3,470 | $10,260 |
| 2022 | $647 | $13,730 | $3,470 | $10,260 |
| 2021 | $665 | $13,730 | $3,470 | $10,260 |
| 2020 | $627 | $11,770 | $2,980 | $8,790 |
| 2019 | $608 | $11,770 | $2,980 | $8,790 |
| 2018 | $600 | $11,770 | $2,980 | $8,790 |
| 2017 | $555 | $9,980 | $3,010 | $6,970 |
| 2016 | $556 | $9,980 | $3,010 | $6,970 |
| 2015 | $538 | $9,980 | $3,010 | $6,970 |
| 2014 | $553 | $10,050 | $3,050 | $7,000 |
| 2013 | $272 | $10,050 | $3,050 | $7,000 |
Source: Public Records
Map
Nearby Homes
- 3305 Regent Ave NE
- 3022 Taft Ave NE
- 3023 Bollinger Ave NE
- 3015 Bollinger Ave NE
- 2017 28th St NE
- 4123 Regentview St NE
- 2827 Daleford Ave NE
- 3504 Fairmount Blvd NE
- 2941 Fletcher Ave NE
- 2602 Baldwin Ave NE
- 2314 24th St NE
- 2310 Willowrow Ave NE
- 1644 33rd St NE
- 1902 39th St NE
- 2940 Ellis Ave NE
- 1912 40th St NE
- 2220 Harrisburg Rd NE
- 1909 Gridley Ave NE
- 2715 19th St NE
- 1601 33rd St NE
- 2605 31st St NE
- 2619 31st St NE
- 3204 Regent Ave NE
- 2621 31st St NE
- 3044 Regent Ave NE
- 2565 31st St NE
- 2618 31st St NE
- 2633 31st St NE
- 2626 31st St NE
- 2559 31st St NE
- 3207 Regent Ave NE
- 3220 Regent Ave NE
- 3034 Regent Ave NE
- 3213 Regent Ave NE
- 2558 31st St NE
- 3207 Morris Ave NE
- 2641 31st St NE
- 3217 Regent Ave NE
- 3221 Morris Ave NE
- 3043 Morris Ave NE