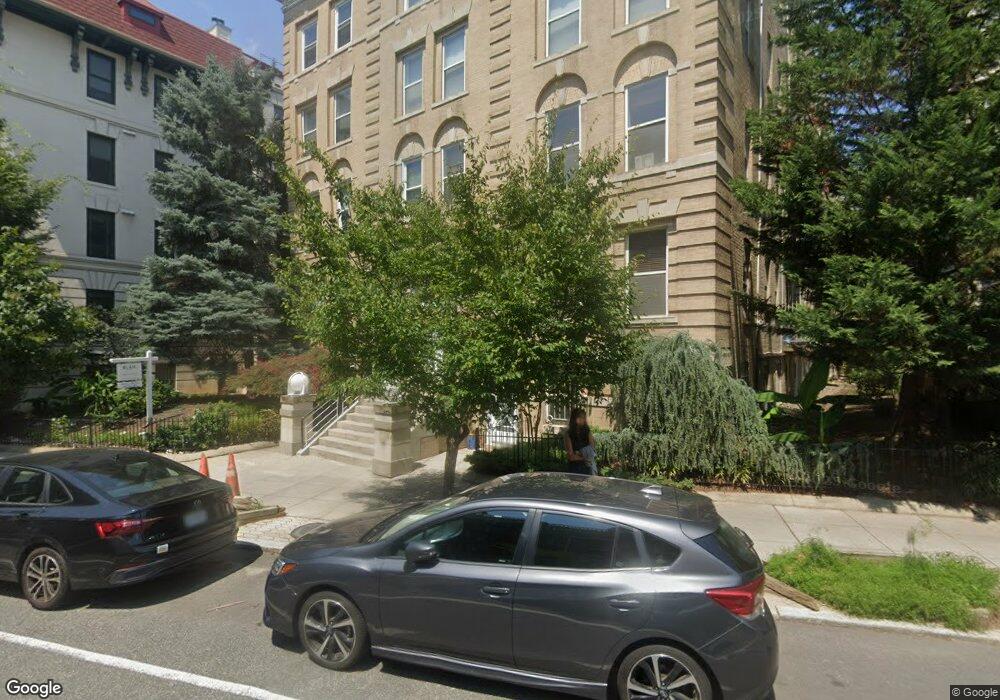
2611 Adams Mill Rd NW Unit 404 Washington, DC 20009
Adams Morgan NeighborhoodEstimated Value: $313,063 - $440,000
1
Bed
1
Bath
526
Sq Ft
$671/Sq Ft
Est. Value
About This Home
This home is located at 2611 Adams Mill Rd NW Unit 404, Washington, DC 20009 and is currently estimated at $352,766, approximately $670 per square foot. 2611 Adams Mill Rd NW Unit 404 is a home located in District of Columbia with nearby schools including H.D. Cooke Elementary School, Columbia Heights Education Campus, and Cardozo Education Campus.
Ownership History
Date
Name
Owned For
Owner Type
Purchase Details
Closed on
Dec 8, 2021
Sold by
Leerar Brenda Kay
Bought by
Lewis Harry G and Leerar Brenda K
Current Estimated Value
Purchase Details
Closed on
Dec 8, 2004
Sold by
Humphries Rhonda
Bought by
Leerar Brenda
Home Financials for this Owner
Home Financials are based on the most recent Mortgage that was taken out on this home.
Original Mortgage
$215,200
Outstanding Balance
$106,676
Interest Rate
5.68%
Mortgage Type
New Conventional
Estimated Equity
$246,090
Purchase Details
Closed on
Oct 1, 1996
Sold by
Federal Nat L Mtg Assn Fnma
Bought by
Humphries Rhonda M
Home Financials for this Owner
Home Financials are based on the most recent Mortgage that was taken out on this home.
Original Mortgage
$64,050
Interest Rate
7.83%
Mortgage Type
FHA
Create a Home Valuation Report for This Property
The Home Valuation Report is an in-depth analysis detailing your home's value as well as a comparison with similar homes in the area
Home Values in the Area
Average Home Value in this Area
Purchase History
| Date | Buyer | Sale Price | Title Company |
|---|---|---|---|
| Lewis Harry G | -- | None Available | |
| Leerar Brenda | $269,000 | -- | |
| Humphries Rhonda M | -- | -- |
Source: Public Records
Mortgage History
| Date | Status | Borrower | Loan Amount |
|---|---|---|---|
| Open | Leerar Brenda | $215,200 | |
| Previous Owner | Humphries Rhonda M | $64,050 |
Source: Public Records
Tax History Compared to Growth
Tax History
| Year | Tax Paid | Tax Assessment Tax Assessment Total Assessment is a certain percentage of the fair market value that is determined by local assessors to be the total taxable value of land and additions on the property. | Land | Improvement |
|---|---|---|---|---|
| 2025 | $2,669 | $329,660 | $98,900 | $230,760 |
| 2024 | $2,733 | $336,720 | $101,020 | $235,700 |
| 2023 | $2,782 | $342,050 | $102,610 | $239,440 |
| 2022 | $2,661 | $326,880 | $98,060 | $228,820 |
| 2021 | $2,683 | $328,970 | $98,690 | $230,280 |
| 2020 | $2,736 | $321,920 | $96,580 | $225,340 |
| 2019 | $2,651 | $311,830 | $93,550 | $218,280 |
| 2018 | $2,637 | $310,250 | $0 | $0 |
| 2017 | $2,573 | $302,730 | $0 | $0 |
| 2016 | $2,570 | $302,330 | $0 | $0 |
| 2015 | $2,440 | $287,090 | $0 | $0 |
| 2014 | -- | $265,240 | $0 | $0 |
Source: Public Records
Map
Nearby Homes
- 2611 Adams Mill Rd NW Unit 208
- 2627 Adams Mill Rd NW Unit 107
- 1794 Lanier Place NW Unit 308
- 1801 Calvert St NW Unit 208
- 2707 Adams Mill Rd NW Unit 205
- 2707 Adams Mill Rd NW Unit 303
- 2707 Adams Mill Rd NW Unit 308
- 2707 Adams Mill Rd NW Unit 206
- 2707 Adams Mill Rd NW Unit 101
- 2707 Adams Mill Rd NW Unit 108
- 1850 Ontario Place NW
- 2630 Adams Mill Rd NW Unit 302
- 2630 Adams Mill Rd NW Unit T06
- 2630 Adams Mill Rd NW Unit 103
- 2516 Cliffbourne Place NW
- 1767 Lanier Place NW Unit 6
- 1748 Lanier Place NW Unit 2
- 1746 Lanier Place NW Unit 3
- 1744 Lanier Place NW Unit 1
- 2801 Adams Mill Rd NW Unit 210
- 2611 Adams Mill Rd NW
- 2611 Adams Mill Rd NW
- 2611 Adams Mill Rd NW
- 2611 Adams Mill Rd NW
- 2611 Adams Mill Rd NW Unit 102
- 2611 Adams Mill Rd NW Unit 103
- 2611 Adams Mill Rd NW Unit 408
- 2611 Adams Mill Rd NW Unit 405
- 2611 Adams Mill Rd NW Unit 107
- 2611 Adams Mill Rd NW Unit 304
- 2611 Adams Mill Rd NW Unit 206
- 2611 Adams Mill Rd NW Unit 308
- 2611 Adams Mill Rd NW Unit T5
- 2611 Adams Mill Rd NW Unit 106
- 2611 Adams Mill Rd NW Unit 201
- 2611 Adams Mill Rd NW Unit 108
- 2611 Adams Mill Rd NW Unit 307
- 2611 Adams Mill Rd NW Unit 306
- 2611 Adams Mill Rd NW Unit 105
- 2611 Adams Mill Rd NW Unit 407