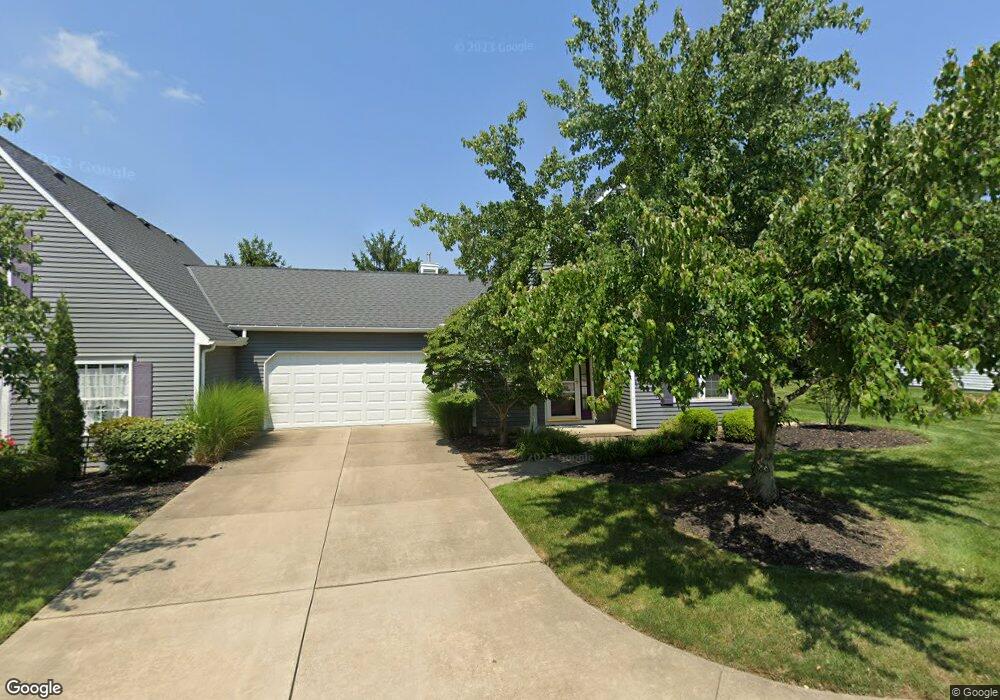
2611 Burridge Cir Unit N31 Twinsburg, OH 44087
Estimated Value: $243,000 - $306,000
2
Beds
2
Baths
1,579
Sq Ft
$169/Sq Ft
Est. Value
About This Home
This home is located at 2611 Burridge Cir Unit N31, Twinsburg, OH 44087 and is currently estimated at $267,008, approximately $169 per square foot. 2611 Burridge Cir Unit N31 is a home located in Summit County with nearby schools including Wilcox Primary School, Dodge Intermediate School, and Samuel Bissell Elementary School.
Ownership History
Date
Name
Owned For
Owner Type
Purchase Details
Closed on
Aug 21, 2007
Sold by
Bednarchik Suzanne
Bought by
Henton Jonnita
Current Estimated Value
Home Financials for this Owner
Home Financials are based on the most recent Mortgage that was taken out on this home.
Original Mortgage
$128,000
Outstanding Balance
$81,498
Interest Rate
6.77%
Mortgage Type
Unknown
Estimated Equity
$185,510
Purchase Details
Closed on
Aug 12, 1999
Sold by
Besecker Charles J
Bought by
Bednarchik Suzanne
Home Financials for this Owner
Home Financials are based on the most recent Mortgage that was taken out on this home.
Original Mortgage
$122,400
Interest Rate
7.91%
Purchase Details
Closed on
Jun 24, 1998
Sold by
Fena Helen
Bought by
Besecker Charles J
Home Financials for this Owner
Home Financials are based on the most recent Mortgage that was taken out on this home.
Original Mortgage
$117,600
Interest Rate
7.27%
Mortgage Type
New Conventional
Create a Home Valuation Report for This Property
The Home Valuation Report is an in-depth analysis detailing your home's value as well as a comparison with similar homes in the area
Home Values in the Area
Average Home Value in this Area
Purchase History
| Date | Buyer | Sale Price | Title Company |
|---|---|---|---|
| Henton Jonnita | $160,000 | Landamerica | |
| Bednarchik Suzanne | $147,000 | Midland Commerce Group | |
| Besecker Charles J | $147,000 | -- |
Source: Public Records
Mortgage History
| Date | Status | Borrower | Loan Amount |
|---|---|---|---|
| Open | Henton Jonnita | $128,000 | |
| Previous Owner | Bednarchik Suzanne | $122,400 | |
| Previous Owner | Besecker Charles J | $117,600 |
Source: Public Records
Tax History Compared to Growth
Tax History
| Year | Tax Paid | Tax Assessment Tax Assessment Total Assessment is a certain percentage of the fair market value that is determined by local assessors to be the total taxable value of land and additions on the property. | Land | Improvement |
|---|---|---|---|---|
| 2025 | $3,600 | $74,817 | $8,705 | $66,112 |
| 2024 | $3,600 | $74,817 | $8,705 | $66,112 |
| 2023 | $3,600 | $74,817 | $8,705 | $66,112 |
| 2022 | $2,883 | $53,438 | $6,216 | $47,222 |
| 2021 | $2,897 | $53,438 | $6,216 | $47,222 |
| 2020 | $2,809 | $53,440 | $6,220 | $47,220 |
| 2019 | $2,751 | $48,900 | $6,090 | $42,810 |
| 2018 | $2,695 | $48,910 | $6,050 | $42,860 |
| 2017 | $2,543 | $48,910 | $6,050 | $42,860 |
| 2016 | $2,527 | $48,910 | $6,050 | $42,860 |
| 2015 | $2,543 | $48,910 | $6,050 | $42,860 |
| 2014 | $2,538 | $48,910 | $6,050 | $42,860 |
| 2013 | $2,586 | $49,900 | $6,050 | $43,850 |
Source: Public Records
Map
Nearby Homes
- 2607 Burridge Cir Unit M29
- 2619 E Aurora Rd
- 10000 Ravenna Rd
- 2869 Tinkers Ln
- 2708 Edgebrook Crossing Unit 19
- V/L- Eton St
- 2055 Rugby St
- 2064 Case St
- 10413 Fox Hollow Cir
- 1959 Rugby St
- 1897 Case St
- 2825 Veron Ln
- 2051 Presidential Pkwy
- 3284 Cannon Rd
- 2015 Presidential Pkwy Unit G60
- 2590 Post Rd
- 9101 Chamberlin Rd
- 3281 Evans Way
- 9452 Fairfield Dr
- 9639 E Idlewood Dr Unit E16
- 2609 Burridge Cir
- 2613 Burridge Cir
- 2635 Burridge Cir Unit T40
- 2635 Burridge Cir Unit 40T
- 2637 Burridge Cir Unit 41T
- 2637 Burridge Cir
- 2607 Burridge Cir Unit 2917
- 2610 Burridge Cir
- 2608 Burridge Cir Unit J18
- 2608 Burridge Cir Unit 18J
- 2639 Burridge Cir
- 2633 Burridge Cir
- 2606 Burridge Cir
- 2612 Burridge Cir
- 2605 Burridge Cir
- 2604 Burridge Cir
- 2604 Burridge Cir Unit 20J
- 2641 Burridge Cir
- 2631 Burridge Cir
- 2603 Burridge Cir