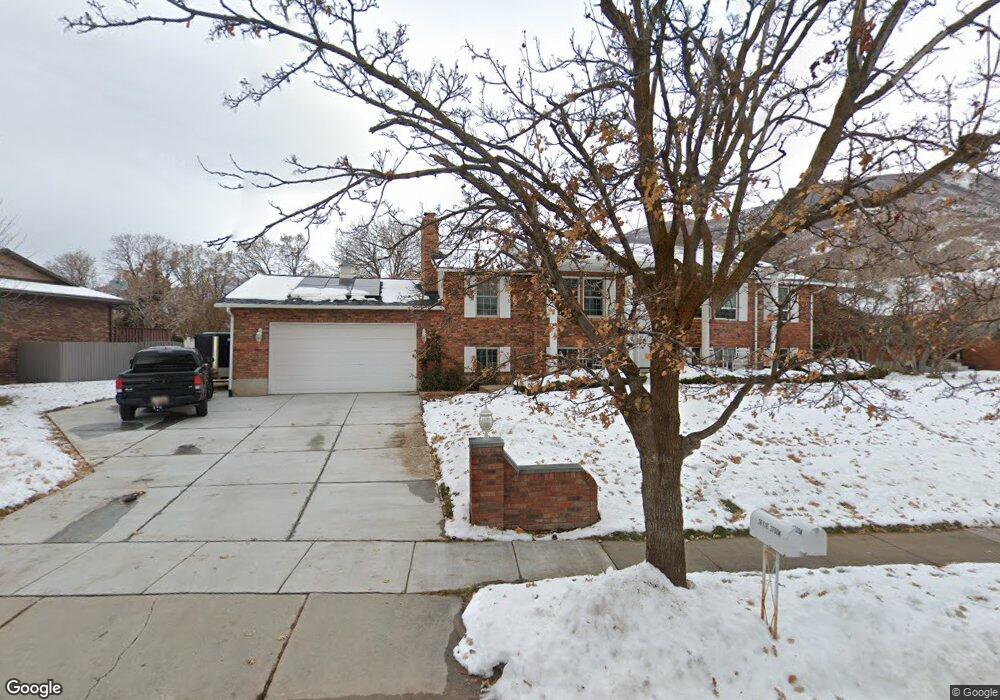
2611 E 2700 N Layton, UT 84040
Estimated Value: $609,000 - $736,000
5
Beds
3
Baths
3,316
Sq Ft
$201/Sq Ft
Est. Value
About This Home
This home is located at 2611 E 2700 N, Layton, UT 84040 and is currently estimated at $666,220, approximately $200 per square foot. 2611 E 2700 N is a home located in Davis County with nearby schools including Sarah Jane Adams Elementary School, North Layton Junior High School, and Northridge High School.
Ownership History
Date
Name
Owned For
Owner Type
Purchase Details
Closed on
Jul 24, 2006
Sold by
Sirva Relocation Llc
Bought by
Colcord Christopher L and Colcord Melody L
Current Estimated Value
Home Financials for this Owner
Home Financials are based on the most recent Mortgage that was taken out on this home.
Original Mortgage
$296,471
Outstanding Balance
$176,396
Interest Rate
6.69%
Mortgage Type
VA
Estimated Equity
$489,824
Purchase Details
Closed on
Jul 20, 2006
Sold by
Wing John L and Wing Cheryle E
Bought by
Sirva Relocation Llc
Home Financials for this Owner
Home Financials are based on the most recent Mortgage that was taken out on this home.
Original Mortgage
$296,471
Outstanding Balance
$176,396
Interest Rate
6.69%
Mortgage Type
VA
Estimated Equity
$489,824
Purchase Details
Closed on
Oct 21, 1996
Sold by
Suter Raymond W and Suter Donna P
Bought by
Wing John L and Wing Cheryle E
Home Financials for this Owner
Home Financials are based on the most recent Mortgage that was taken out on this home.
Original Mortgage
$207,000
Interest Rate
8.3%
Create a Home Valuation Report for This Property
The Home Valuation Report is an in-depth analysis detailing your home's value as well as a comparison with similar homes in the area
Home Values in the Area
Average Home Value in this Area
Purchase History
| Date | Buyer | Sale Price | Title Company |
|---|---|---|---|
| Colcord Christopher L | -- | Bonneville Superior Title Co | |
| Sirva Relocation Llc | -- | Bonneville Superior Title Co | |
| Wing John L | -- | Bonneville Title Company Inc |
Source: Public Records
Mortgage History
| Date | Status | Borrower | Loan Amount |
|---|---|---|---|
| Open | Colcord Christopher L | $296,471 | |
| Previous Owner | Wing John L | $207,000 |
Source: Public Records
Tax History
| Year | Tax Paid | Tax Assessment Tax Assessment Total Assessment is a certain percentage of the fair market value that is determined by local assessors to be the total taxable value of land and additions on the property. | Land | Improvement |
|---|---|---|---|---|
| 2025 | $2,444 | $332,750 | $155,779 | $176,971 |
| 2024 | $2,314 | $321,200 | $173,294 | $147,906 |
| 2023 | $3,296 | $577,000 | $221,539 | $355,461 |
| 2022 | $3,410 | $326,150 | $119,875 | $206,275 |
| 2021 | $2,820 | $399,000 | $184,118 | $214,882 |
| 2020 | $2,577 | $349,000 | $155,936 | $193,064 |
| 2019 | $2,511 | $335,000 | $137,793 | $197,207 |
| 2018 | $2,336 | $313,000 | $112,779 | $200,221 |
| 2016 | $2,134 | $150,095 | $58,191 | $91,904 |
| 2015 | $2,235 | $150,590 | $58,191 | $92,399 |
| 2014 | $1,831 | $126,261 | $58,191 | $68,070 |
| 2013 | -- | $130,571 | $36,182 | $94,389 |
Source: Public Records
Map
Nearby Homes
- 2597 N 2300 E
- 2569 N 2900 E
- 2353 Canyon View Dr
- 2563 E 2250 N
- 2136 N 2800 E
- 1935 Deere Valley Dr
- 2340 N 2050 E
- 1911 Deere Valley Dr
- 3297 N Layton Ridge Dr
- 3232 N Redtail Way
- 1954 N 2600 E
- 2273 N 1975 E
- 2547 E 1900 N
- 2509 E 1900 N
- 1821 E Whitetail Way
- 1785 E 2825 N
- 1827 E Whitetail Dr
- 1731 E 2825 N
- 1960 N 2150 E
- 2189 N 1950 E
Your Personal Tour Guide
Ask me questions while you tour the home.