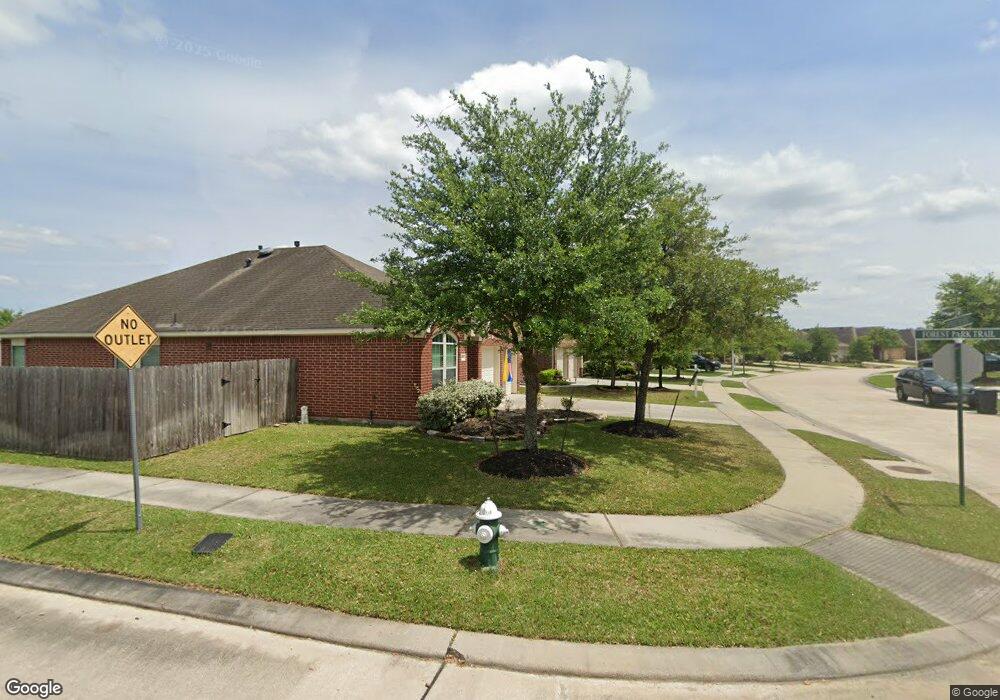
2611 Imperial Crossing Dr Conroe, TX 77385
Imperial Oaks NeighborhoodEstimated Value: $272,000 - $306,000
3
Beds
2
Baths
1,701
Sq Ft
$167/Sq Ft
Est. Value
About This Home
This home is located at 2611 Imperial Crossing Dr, Conroe, TX 77385 and is currently estimated at $284,661, approximately $167 per square foot. 2611 Imperial Crossing Dr is a home located in Montgomery County with nearby schools including Kaufman Elementary School, Vogel Intermediate School, and Irons J High School.
Ownership History
Date
Name
Owned For
Owner Type
Purchase Details
Closed on
Aug 2, 2024
Sold by
Nossa Susan and Nossa Jorge
Bought by
Jorge And Susan Nossa Revocable Trust and Nossa
Current Estimated Value
Purchase Details
Closed on
Sep 20, 2012
Sold by
Guyer Robert and Guyer Keli
Bought by
Nossa Susan and Nossa Jorge
Purchase Details
Closed on
Mar 9, 2009
Sold by
Perry Homes Llc
Bought by
Guyer Robert
Home Financials for this Owner
Home Financials are based on the most recent Mortgage that was taken out on this home.
Original Mortgage
$136,762
Interest Rate
5.06%
Mortgage Type
FHA
Purchase Details
Closed on
Jul 22, 2008
Sold by
2005 Imperial Oaks Ltd
Bought by
Perry Homes Llc
Create a Home Valuation Report for This Property
The Home Valuation Report is an in-depth analysis detailing your home's value as well as a comparison with similar homes in the area
Home Values in the Area
Average Home Value in this Area
Purchase History
| Date | Buyer | Sale Price | Title Company |
|---|---|---|---|
| Jorge And Susan Nossa Revocable Trust | -- | None Listed On Document | |
| Nossa Susan | -- | First American Title | |
| Nossa Jorge | -- | -- | |
| Guyer Robert | -- | Chicago Title | |
| Perry Homes Llc | -- | Chicago Title |
Source: Public Records
Mortgage History
| Date | Status | Borrower | Loan Amount |
|---|---|---|---|
| Previous Owner | Guyer Robert | $136,762 |
Source: Public Records
Tax History Compared to Growth
Tax History
| Year | Tax Paid | Tax Assessment Tax Assessment Total Assessment is a certain percentage of the fair market value that is determined by local assessors to be the total taxable value of land and additions on the property. | Land | Improvement |
|---|---|---|---|---|
| 2025 | $4,147 | $290,303 | -- | -- |
| 2024 | $3,909 | $263,912 | -- | -- |
| 2023 | $3,909 | $239,920 | $58,000 | $225,190 |
| 2022 | $6,871 | $218,110 | $24,880 | $219,470 |
| 2021 | $6,560 | $198,280 | $24,880 | $173,400 |
| 2020 | $6,369 | $186,000 | $24,880 | $161,120 |
| 2019 | $6,408 | $183,380 | $24,880 | $158,500 |
| 2018 | $4,850 | $171,640 | $24,880 | $146,760 |
| 2017 | $5,993 | $171,640 | $24,880 | $146,760 |
| 2016 | $6,100 | $174,700 | $24,880 | $149,820 |
| 2015 | $4,108 | $163,160 | $24,880 | $139,030 |
| 2014 | $4,108 | $148,330 | $24,880 | $123,450 |
Source: Public Records
Map
Nearby Homes
- 2611 Winding Creek Way
- 2614 Winding Creek Way
- 2611 Cedar Path Ln
- 2623 Cedar Path Ln
- 2610 Cedar Path Ln
- 32315 Golden Oak Park Ln
- 31903 Burnt Wood Ct
- 32331 Summer Park Ln
- 2707 Oak Pass Ct
- 32319 Archer Park
- 2643 Imperial Grove Ln
- 31815 Forest Oak Ln
- 31810 Forest Oak Ln
- 2606 Ivy Wood Ln
- 2645 Ivy Wood Ln
- 2626 Ivy Wood Ln
- 2754 Hidden Hollow Ln
- 31602 Forest Oak Park Ct
- 32094 Quail Terrace Ln
- 2614 Oakland Park Dr
- 2607 Imperial Crossing Dr
- 2615 Imperial Crossing Dr
- 2603 Imperial Crossing Dr
- 2619 Imperial Crossing Dr
- 2610 Imperial Crossing Dr
- 31870 Forest Park Trail
- 2618 Imperial Crossing Dr
- 2623 Imperial Crossing Dr
- 2602 Imperial Crossing Dr
- 2626 Imperial Crossing Dr
- 31874 Forest Park Trail
- 2631 Imperial Crossing Dr
- 31867 Forest Park Trail
- 2627 Imperial Crossing Dr
- 31878 Forest Park Trail
- 31859 Forest Park Trail
- 31863 Forest Park Trail
- 31851 Forest Park Trail
- 31855 Forest Park Trail
- 31838 Forest Park Ct