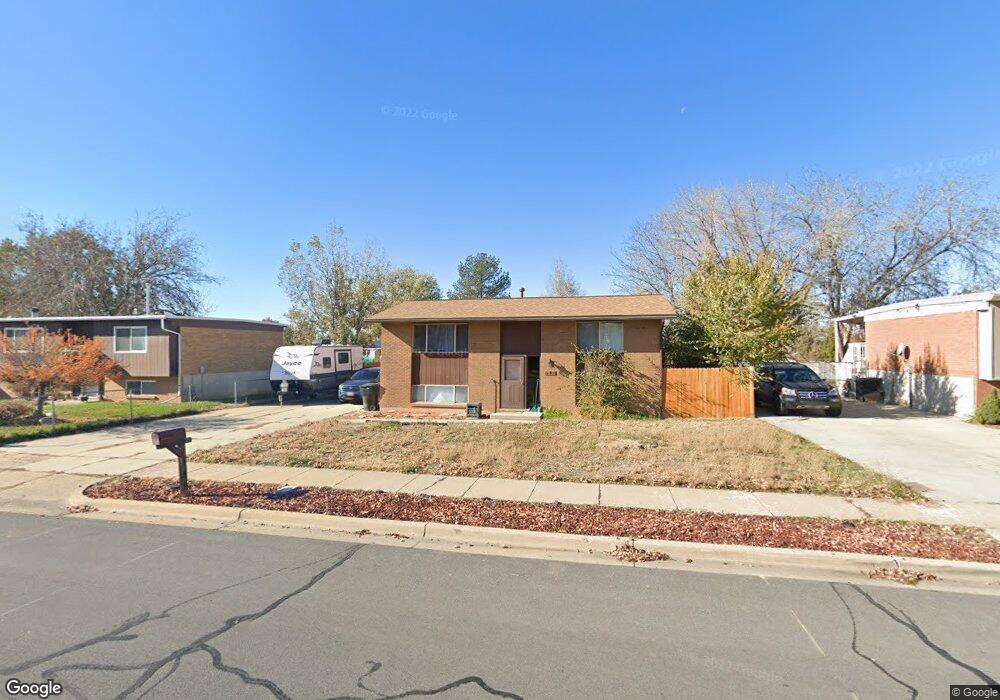
2611 N 770 W Clearfield, UT 84015
Estimated Value: $394,000 - $428,897
4
Beds
2
Baths
1,850
Sq Ft
$224/Sq Ft
Est. Value
About This Home
This home is located at 2611 N 770 W, Clearfield, UT 84015 and is currently estimated at $413,974, approximately $223 per square foot. 2611 N 770 W is a home located in Davis County with nearby schools including Fremont School, Sunset Junior High School, and Northridge High School.
Ownership History
Date
Name
Owned For
Owner Type
Purchase Details
Closed on
Dec 12, 2019
Sold by
Huckaby Tillie and Huckaby Terry T
Bought by
Leseberg Amber
Current Estimated Value
Home Financials for this Owner
Home Financials are based on the most recent Mortgage that was taken out on this home.
Original Mortgage
$232,800
Outstanding Balance
$205,210
Interest Rate
3.7%
Mortgage Type
New Conventional
Estimated Equity
$208,764
Purchase Details
Closed on
Jun 16, 2018
Sold by
Huckaby Terry Lyn and Huckaby Marcy D
Bought by
Huckaby Tillie and Huckaby Terry T
Purchase Details
Closed on
Sep 15, 1997
Sold by
Harris Frank E and Harris Mary Lou
Bought by
Huckaby Terry Lynn and Huckaby Marcy D
Home Financials for this Owner
Home Financials are based on the most recent Mortgage that was taken out on this home.
Original Mortgage
$16,000
Interest Rate
7.34%
Mortgage Type
Seller Take Back
Create a Home Valuation Report for This Property
The Home Valuation Report is an in-depth analysis detailing your home's value as well as a comparison with similar homes in the area
Home Values in the Area
Average Home Value in this Area
Purchase History
| Date | Buyer | Sale Price | Title Company |
|---|---|---|---|
| Leseberg Amber | -- | Synergy Title | |
| Huckaby Tillie | -- | None Available | |
| Huckaby Terry Lynn | -- | Associated Title Company |
Source: Public Records
Mortgage History
| Date | Status | Borrower | Loan Amount |
|---|---|---|---|
| Open | Leseberg Amber | $232,800 | |
| Previous Owner | Huckaby Terry Lynn | $16,000 |
Source: Public Records
Tax History Compared to Growth
Tax History
| Year | Tax Paid | Tax Assessment Tax Assessment Total Assessment is a certain percentage of the fair market value that is determined by local assessors to be the total taxable value of land and additions on the property. | Land | Improvement |
|---|---|---|---|---|
| 2025 | $2,219 | $213,400 | $91,346 | $122,054 |
| 2024 | $2,151 | $207,900 | $100,306 | $107,594 |
| 2023 | $1,974 | $353,000 | $114,302 | $238,698 |
| 2022 | $2,074 | $205,150 | $69,701 | $135,449 |
| 2021 | $1,983 | $291,000 | $87,625 | $203,375 |
| 2020 | $1,707 | $248,000 | $74,651 | $173,349 |
| 2019 | $1,431 | $203,000 | $86,875 | $116,125 |
| 2018 | $1,255 | $175,000 | $73,331 | $101,669 |
| 2016 | $1,066 | $76,725 | $28,596 | $48,129 |
| 2015 | $1,055 | $70,455 | $28,596 | $41,859 |
| 2014 | $928 | $64,512 | $28,596 | $35,916 |
| 2013 | -- | $68,678 | $25,230 | $43,448 |
Source: Public Records
Map
Nearby Homes