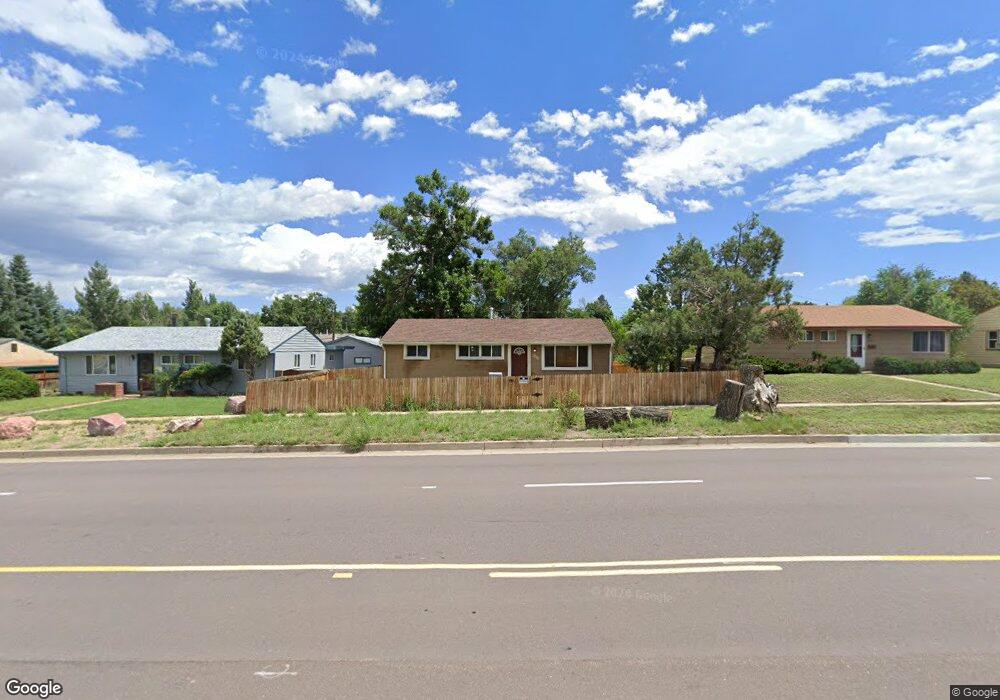
2611 N Union Blvd Colorado Springs, CO 80909
Palmer Park NeighborhoodEstimated Value: $334,178 - $347,000
3
Beds
1
Bath
1,025
Sq Ft
$330/Sq Ft
Est. Value
About This Home
This home is located at 2611 N Union Blvd, Colorado Springs, CO 80909 and is currently estimated at $338,295, approximately $330 per square foot. 2611 N Union Blvd is a home located in El Paso County with nearby schools including Audubon Elementary School, Mann Middle School, and William J. Palmer High School.
Ownership History
Date
Name
Owned For
Owner Type
Purchase Details
Closed on
Oct 21, 2019
Sold by
Howell David W
Bought by
Reilly Kathryn
Current Estimated Value
Home Financials for this Owner
Home Financials are based on the most recent Mortgage that was taken out on this home.
Original Mortgage
$22,583,400
Outstanding Balance
$19,824,505
Interest Rate
3.6%
Mortgage Type
FHA
Estimated Equity
-$19,486,210
Purchase Details
Closed on
Mar 25, 2016
Sold by
Howell David W
Bought by
Howell David W and Howell Diva Castillo
Home Financials for this Owner
Home Financials are based on the most recent Mortgage that was taken out on this home.
Original Mortgage
$172,812
Interest Rate
4.12%
Mortgage Type
FHA
Purchase Details
Closed on
Oct 30, 2015
Sold by
Phipps Randal and Fuss Jeffrey
Bought by
Superior Renovated Homes Llc
Purchase Details
Closed on
Jan 27, 1997
Sold by
Burley Bonnie Jeanne
Bought by
Stewart Bonnie J
Purchase Details
Closed on
Jan 24, 1996
Sold by
Maytubby Calvin F and Maytubby Irene
Bought by
Burley Bonnie Jeanne
Create a Home Valuation Report for This Property
The Home Valuation Report is an in-depth analysis detailing your home's value as well as a comparison with similar homes in the area
Home Values in the Area
Average Home Value in this Area
Purchase History
| Date | Buyer | Sale Price | Title Company |
|---|---|---|---|
| Reilly Kathryn | $230,000 | First American | |
| Howell David W | -- | Heritage Title | |
| Howell David W | $176,000 | Heritage Title | |
| Superior Renovated Homes Llc | $70,000 | Heritage Title | |
| Stewart Bonnie J | -- | -- | |
| Burley Bonnie Jeanne | -- | -- |
Source: Public Records
Mortgage History
| Date | Status | Borrower | Loan Amount |
|---|---|---|---|
| Open | Reilly Kathryn | $22,583,400 | |
| Previous Owner | Howell David W | $172,812 |
Source: Public Records
Tax History Compared to Growth
Tax History
| Year | Tax Paid | Tax Assessment Tax Assessment Total Assessment is a certain percentage of the fair market value that is determined by local assessors to be the total taxable value of land and additions on the property. | Land | Improvement |
|---|---|---|---|---|
| 2025 | $1,034 | $23,140 | -- | -- |
| 2024 | $924 | $22,990 | $3,870 | $19,120 |
| 2022 | $956 | $17,080 | $2,860 | $14,220 |
| 2021 | $1,037 | $17,580 | $2,950 | $14,630 |
| 2020 | $1,056 | $15,560 | $2,570 | $12,990 |
| 2019 | $1,050 | $15,560 | $2,570 | $12,990 |
| 2018 | $925 | $12,610 | $2,070 | $10,540 |
| 2017 | $876 | $12,610 | $2,070 | $10,540 |
| 2016 | $616 | $10,620 | $2,150 | $8,470 |
| 2015 | $613 | $10,620 | $2,150 | $8,470 |
| 2014 | $598 | $9,930 | $2,150 | $7,780 |
Source: Public Records
Map
Nearby Homes
- 2518 Jay Place
- 2436 N Meade Ave
- 2615 Meadowlark Ln
- 2524 Meadowlark Ln
- 2432 Farragut Ave
- 1412 Seasons Grove
- 2462 Lafayette Rd
- 2306 N Union Blvd
- 2318 Farragut Ave
- 2817 Lewis Meadows View
- 2330 Eagle View Dr
- 2620 Fairway Dr
- 2502 Fairway Dr
- 3114 Templeton Gap Rd
- 2423 Paseo Rd Unit B4
- 2108 Eagle View Dr
- 1313 Pioneer Rd
- 1314 Pioneer Rd
- 1321 Columbine Blvd
- 2227 Monteagle St
- 2605 N Union Blvd
- 2615 N Union Blvd
- 2529 N Union Blvd
- 2619 N Union Blvd
- 2610 Bonfoy Ave
- 2604 Bonfoy Ave
- 2530 Bonfoy Ave
- 2525 N Union Blvd
- 2614 Bonfoy Ave
- 2526 Bonfoy Ave
- 2608 N Union Blvd
- 2612 N Union Blvd
- 2604 N Union Blvd
- 2521 N Union Blvd
- 2618 N Union Blvd
- 2618 Bonfoy Ave
- 2528 N Union Blvd
- 2520 Bonfoy Ave
- 2609 Bonfoy Ave
- 2524 N Union Blvd