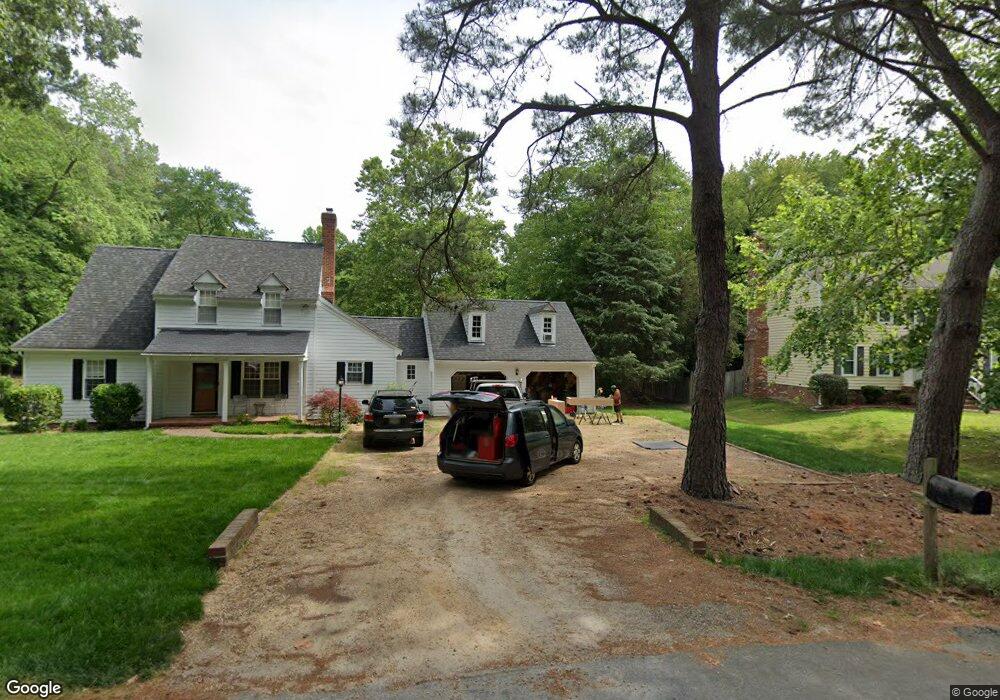
2611 Torquay Loop North Chesterfield, VA 23236
Estimated Value: $412,310 - $460,000
4
Beds
3
Baths
2,030
Sq Ft
$215/Sq Ft
Est. Value
About This Home
This home is located at 2611 Torquay Loop, North Chesterfield, VA 23236 and is currently estimated at $436,828, approximately $215 per square foot. 2611 Torquay Loop is a home located in Chesterfield County with nearby schools including Providence Elementary School, Providence Middle School, and Monacan High School.
Ownership History
Date
Name
Owned For
Owner Type
Purchase Details
Closed on
Sep 12, 2003
Sold by
Sals Josie
Bought by
Johannes Kelly
Current Estimated Value
Home Financials for this Owner
Home Financials are based on the most recent Mortgage that was taken out on this home.
Original Mortgage
$176,600
Outstanding Balance
$81,812
Interest Rate
6.22%
Mortgage Type
New Conventional
Estimated Equity
$355,016
Create a Home Valuation Report for This Property
The Home Valuation Report is an in-depth analysis detailing your home's value as well as a comparison with similar homes in the area
Home Values in the Area
Average Home Value in this Area
Purchase History
| Date | Buyer | Sale Price | Title Company |
|---|---|---|---|
| Johannes Kelly | $186,050 | -- |
Source: Public Records
Mortgage History
| Date | Status | Borrower | Loan Amount |
|---|---|---|---|
| Open | Johannes Kelly | $176,600 |
Source: Public Records
Tax History Compared to Growth
Tax History
| Year | Tax Paid | Tax Assessment Tax Assessment Total Assessment is a certain percentage of the fair market value that is determined by local assessors to be the total taxable value of land and additions on the property. | Land | Improvement |
|---|---|---|---|---|
| 2025 | $3,455 | $385,400 | $68,000 | $317,400 |
| 2024 | $3,455 | $357,800 | $63,000 | $294,800 |
| 2023 | $3,245 | $342,000 | $60,000 | $282,000 |
| 2022 | $2,899 | $315,100 | $58,000 | $257,100 |
| 2021 | $2,492 | $259,700 | $54,000 | $205,700 |
| 2020 | $2,467 | $259,700 | $54,000 | $205,700 |
| 2019 | $2,467 | $259,700 | $54,000 | $205,700 |
| 2018 | $2,237 | $235,500 | $52,000 | $183,500 |
| 2017 | $2,143 | $223,200 | $52,000 | $171,200 |
| 2016 | $2,100 | $218,700 | $52,000 | $166,700 |
| 2015 | $2,072 | $215,800 | $50,000 | $165,800 |
| 2014 | $2,047 | $213,200 | $50,000 | $163,200 |
Source: Public Records
Map
Nearby Homes
- 8703 Ewes Ct
- 2612 Wicklow Loop
- 2821 Newquay Ln
- 9010 Kings Crown Rd
- 2303 Cardiff Place
- 2700 Walhala Dr
- 3832 Foxglove Rd
- Lexington Plan at Wyntrebrooke Village
- Covington Plan at Wyntrebrooke Village
- Arlington Plan at Wyntrebrooke Village
- Shenandoah Plan at Wyntrebrooke Village
- Louisa Plan at Wyntrebrooke Village
- 8832 Lyndale Dr
- 2502 Foxberry Cir
- 7961 Lyndale Dr
- 7949 Lyndale Dr
- 4121 Foxglove Rd
- 4029 Flintridge Rd
- 7931 Lyndale Dr
- 3403 Fallbrooke Ct
- 2613 Torquay Loop
- 8711 Ewes Ct
- 2609 Torquay Loop
- 8713 Ewes Ct
- 8709 Ewes Ct
- 2612 Torquay Loop
- 2610 Torquay Loop
- 8712 Ewes Ct
- 8707 Ewes Ct
- 2607 Torquay Loop
- 2641 Rams
- 2615 Torquay Loop
- 2608 Torquay Loop
- 2605 Torquay Loop
- 8705 Ewes Ct
- 8710 Ewes Ct
- 8802 Rams Cir
- 2700 Rams Ct
- 2606 Torquay Loop
- 2502 Llama Ln