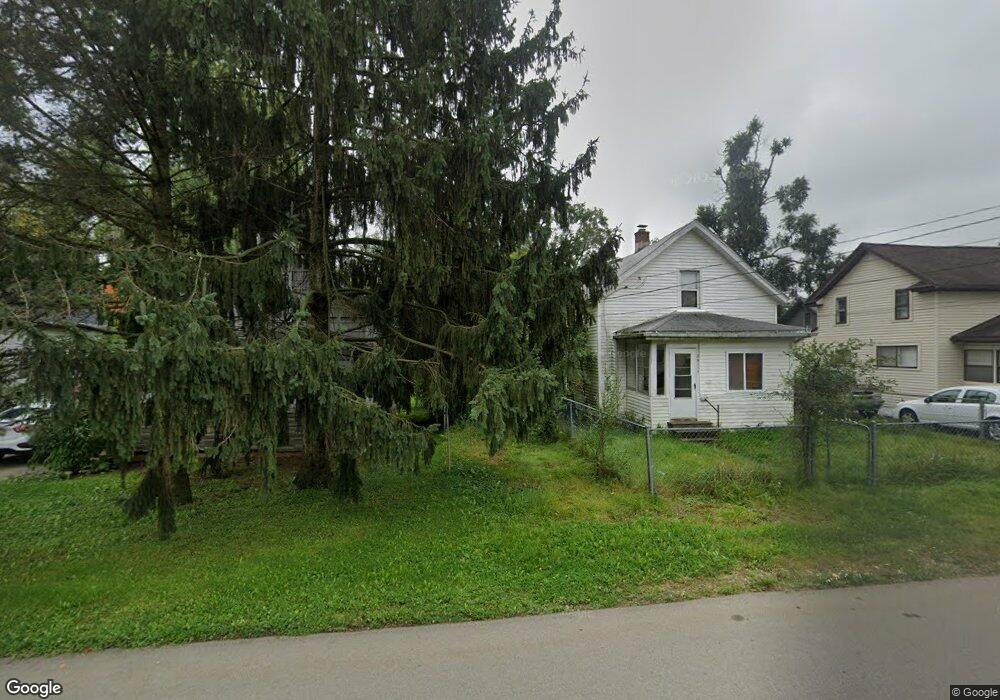
2611 Tyson St Jackson, MI 49203
Estimated Value: $77,861 - $106,000
2
Beds
1
Bath
869
Sq Ft
$110/Sq Ft
Est. Value
About This Home
This home is located at 2611 Tyson St, Jackson, MI 49203 and is currently estimated at $95,215, approximately $109 per square foot. 2611 Tyson St is a home located in Jackson County with nearby schools including East Jackson Elementary School, East Jackson Middle School, and East Jackson High School.
Ownership History
Date
Name
Owned For
Owner Type
Purchase Details
Closed on
May 14, 2005
Sold by
Kirven Rose H
Bought by
Kirven Lawrence
Current Estimated Value
Home Financials for this Owner
Home Financials are based on the most recent Mortgage that was taken out on this home.
Original Mortgage
$58,500
Outstanding Balance
$30,952
Interest Rate
6.07%
Mortgage Type
Fannie Mae Freddie Mac
Estimated Equity
$64,263
Purchase Details
Closed on
Aug 3, 1998
Sold by
Kirven Rose
Bought by
Broyles Thomas C and Broyles Glenda G
Create a Home Valuation Report for This Property
The Home Valuation Report is an in-depth analysis detailing your home's value as well as a comparison with similar homes in the area
Home Values in the Area
Average Home Value in this Area
Purchase History
| Date | Buyer | Sale Price | Title Company |
|---|---|---|---|
| Kirven Lawrence | -- | Chicago Title | |
| Broyles Thomas C | -- | -- |
Source: Public Records
Mortgage History
| Date | Status | Borrower | Loan Amount |
|---|---|---|---|
| Open | Kirven Lawrence | $58,500 |
Source: Public Records
Tax History
| Year | Tax Paid | Tax Assessment Tax Assessment Total Assessment is a certain percentage of the fair market value that is determined by local assessors to be the total taxable value of land and additions on the property. | Land | Improvement |
|---|---|---|---|---|
| 2025 | $1,514 | $34,000 | $0 | $0 |
| 2024 | $11 | $35,000 | $0 | $0 |
| 2023 | $1,060 | $32,600 | $0 | $0 |
| 2022 | $1,365 | $27,200 | $0 | $0 |
| 2021 | $1,334 | $23,800 | $0 | $0 |
| 2020 | $1,316 | $23,800 | $0 | $0 |
| 2019 | $1,282 | $23,500 | $0 | $0 |
| 2018 | $1,198 | $22,000 | $0 | $0 |
| 2017 | $1,265 | $28,500 | $0 | $0 |
| 2016 | $992 | $28,086 | $28,086 | $0 |
| 2015 | $1,250 | $23,512 | $23,512 | $0 |
| 2014 | $1,250 | $23,812 | $23,812 | $0 |
| 2013 | -- | $23,812 | $23,812 | $0 |
Source: Public Records
Map
Nearby Homes
- 111 N Forbes St
- Vl Watts St
- 2636 Hickory St
- 106 N Dwight St
- 131 Willow St
- 149 Mantle Ave
- 509 S Gorham St
- 134 N Gorham St
- 127 Bates St
- 205 S Dettman Rd
- 141 Bates St
- 143 Bates St
- 213 N Gorham St
- 209 N Pleasant St
- 417 Lockwood St
- 3227 Matthews St
- 339 N Dwight St
- 306 N Pleasant St
- 319 N Gorham St
- 900 S Roberts St
Your Personal Tour Guide
Ask me questions while you tour the home.