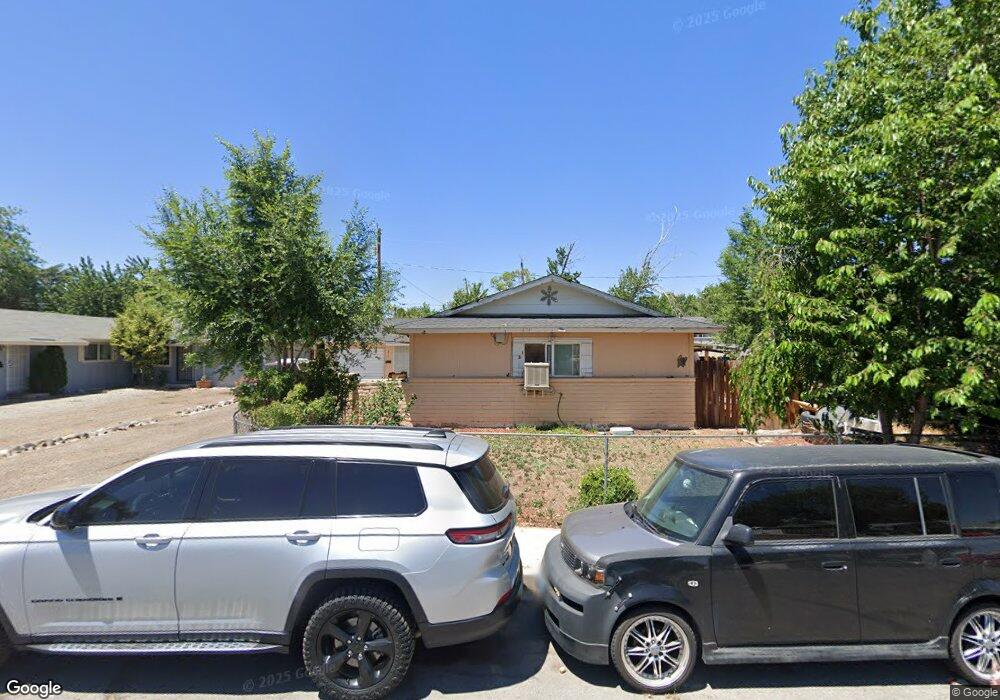
2611 W Cygnet Cir Sparks, NV 89431
Downtown Sparks NeighborhoodEstimated Value: $424,779 - $590,000
4
Beds
2
Baths
1,728
Sq Ft
$292/Sq Ft
Est. Value
About This Home
This home is located at 2611 W Cygnet Cir, Sparks, NV 89431 and is currently estimated at $504,445, approximately $291 per square foot. 2611 W Cygnet Cir is a home located in Washoe County with nearby schools including Bernice Mathews Elementary School, Fred W. Traner Middle School, and Procter R. Hug High School.
Ownership History
Date
Name
Owned For
Owner Type
Purchase Details
Closed on
Jul 29, 2021
Sold by
Cruz Cruz Perfecto Perfecto and Cruz Perfecto C
Bought by
Cruz Cruz Perfecto Perfecto and Delreal Norma Decruz
Current Estimated Value
Purchase Details
Closed on
Jun 18, 1999
Sold by
Cruz Norma
Bought by
Cruz Perfecto C
Home Financials for this Owner
Home Financials are based on the most recent Mortgage that was taken out on this home.
Original Mortgage
$89,550
Outstanding Balance
$23,539
Interest Rate
7.01%
Estimated Equity
$480,906
Purchase Details
Closed on
May 24, 1999
Sold by
Ghaffar Adli Reza Ghaffar and Ghaffar Adli Akram
Bought by
Cruz Perfecto C
Home Financials for this Owner
Home Financials are based on the most recent Mortgage that was taken out on this home.
Original Mortgage
$89,550
Outstanding Balance
$23,539
Interest Rate
7.01%
Estimated Equity
$480,906
Purchase Details
Closed on
Dec 18, 1993
Sold by
Ghaffar Adli Reza Ghaffar and Ghaffar Adli Akram
Bought by
Ghaffar Adli Reza Ghaffar and Ghaffar Adli Akram
Create a Home Valuation Report for This Property
The Home Valuation Report is an in-depth analysis detailing your home's value as well as a comparison with similar homes in the area
Home Values in the Area
Average Home Value in this Area
Purchase History
| Date | Buyer | Sale Price | Title Company |
|---|---|---|---|
| Cruz Cruz Perfecto Perfecto | -- | None Available | |
| Cruz Perfecto C | -- | First American Title Co | |
| Cruz Perfecto C | $99,500 | First American Title Co | |
| Ghaffar Adli Reza Ghaffar | -- | -- |
Source: Public Records
Mortgage History
| Date | Status | Borrower | Loan Amount |
|---|---|---|---|
| Open | Cruz Perfecto C | $89,550 |
Source: Public Records
Tax History Compared to Growth
Tax History
| Year | Tax Paid | Tax Assessment Tax Assessment Total Assessment is a certain percentage of the fair market value that is determined by local assessors to be the total taxable value of land and additions on the property. | Land | Improvement |
|---|---|---|---|---|
| 2025 | $1,203 | $62,087 | $41,720 | $20,367 |
| 2024 | $1,170 | $58,422 | $38,710 | $19,712 |
| 2023 | $1,170 | $57,320 | $39,305 | $18,015 |
| 2022 | $1,191 | $48,955 | $32,865 | $16,090 |
| 2021 | $1,105 | $41,973 | $25,375 | $16,598 |
| 2020 | $1,071 | $43,425 | $26,250 | $17,175 |
| 2019 | $1,038 | $39,571 | $22,470 | $17,101 |
| 2018 | $1,011 | $32,350 | $15,190 | $17,160 |
| 2017 | $982 | $31,444 | $14,000 | $17,444 |
| 2016 | $956 | $29,467 | $11,200 | $18,267 |
| 2015 | $485 | $26,992 | $8,050 | $18,942 |
| 2014 | $927 | $25,392 | $7,000 | $18,392 |
| 2013 | -- | $24,567 | $6,160 | $18,407 |
Source: Public Records
Map
Nearby Homes
- 2335 Roundhouse Rd
- 2380 Roundhouse Rd
- 2385 Pauline Ave
- 2136 Roundhouse Rd
- 135 Carnation Ln
- 168 Poppy Ln
- 113 Lilac Ln
- 2168 Cannonball Rd
- 112 Lilac Ln
- 2301 Oddie Blvd Unit 56
- 2301 Oddie Blvd Unit 162
- 2301 Oddie Blvd Unit 18
- 1990 Trainer Way
- 1885 Castle Way
- 1889 Merchant St
- 1830 C St
- 1756 I St
- 1841 Merchant St
- 1855 Verano Dr
- 2602 Fanto Ct Unit 17
- 2615 W Cygnet Cir
- 2607 W Cygnet Cir
- 1150 Shoshone Dr
- 2619 W Cygnet Cir
- 1130 Shoshone Dr
- 1180 Shoshone Dr
- 2603 W Cygnet Cir
- 2610 W Cygnet Cir
- 1100 Shoshone Dr
- 2623 W Cygnet Cir
- 2599 W Cygnet Cir
- 1190 Shoshone Dr
- 1080 Shoshone Dr
- 2618 W Cygnet Cir
- 2595 W Cygnet Cir
- 2595 & 2597 W Cygnet Cir
- 2594 E Cygnet Cir
- 2627 W Cygnet Cir
- 1155 Shoshone Dr
- 2622 W Cygnet Cir Unit 2