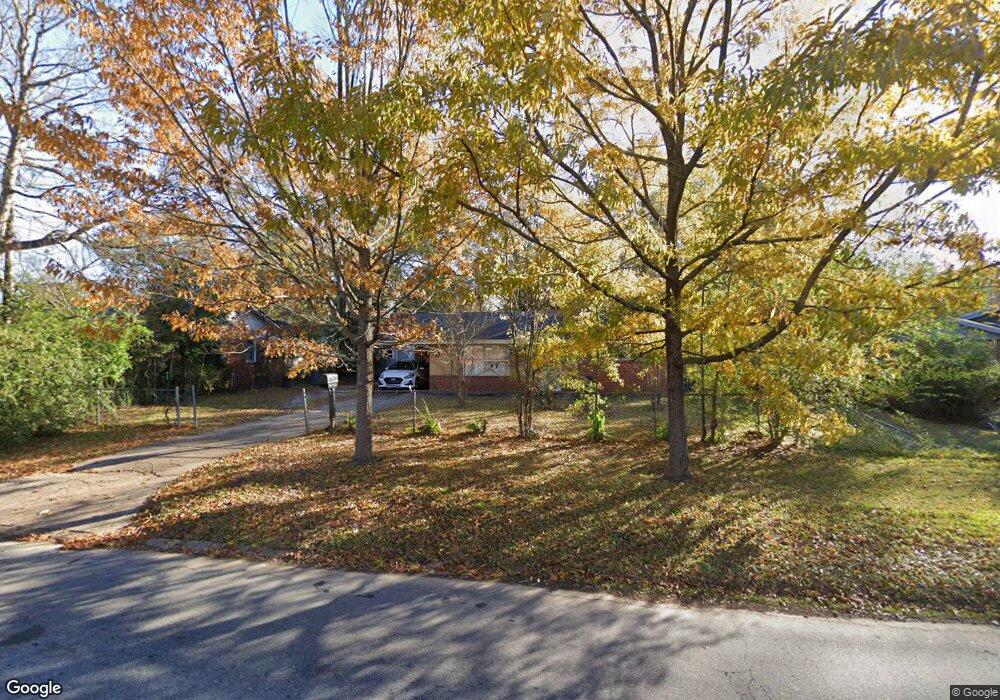
2612 Blan St Columbus, GA 31903
Southern Columbus NeighborhoodEstimated Value: $54,000 - $102,000
3
Beds
2
Baths
988
Sq Ft
$76/Sq Ft
Est. Value
About This Home
This home is located at 2612 Blan St, Columbus, GA 31903 and is currently estimated at $75,044, approximately $75 per square foot. 2612 Blan St is a home located in Muscogee County with nearby schools including Key Elementary School, Eddy Middle School, and Spencer High School.
Ownership History
Date
Name
Owned For
Owner Type
Purchase Details
Closed on
Jul 25, 2023
Sold by
Turman William E and Turman Dixie C
Bought by
William E Turman Revocable Trust and Turman
Current Estimated Value
Purchase Details
Closed on
Jun 24, 2020
Sold by
Mcbride J Marvin
Bought by
Turman William E and Turman Dixie C
Purchase Details
Closed on
May 22, 2020
Sold by
Hart Jeffrey
Bought by
Mcbride Marvin and Mcbride Susan
Purchase Details
Closed on
Mar 12, 2020
Sold by
Martin Harvey Price
Bought by
Hart Jeffrey
Purchase Details
Closed on
Mar 11, 2020
Sold by
Martin Maria Hart
Bought by
Martin Harvey Price and Hart Jeffrey
Create a Home Valuation Report for This Property
The Home Valuation Report is an in-depth analysis detailing your home's value as well as a comparison with similar homes in the area
Home Values in the Area
Average Home Value in this Area
Purchase History
| Date | Buyer | Sale Price | Title Company |
|---|---|---|---|
| William E Turman Revocable Trust | -- | None Listed On Document | |
| Turman William E | $35,500 | -- | |
| Mcbride Marvin | -- | -- | |
| Hart Jeffrey | -- | -- | |
| Martin Harvey Price | -- | -- |
Source: Public Records
Tax History Compared to Growth
Tax History
| Year | Tax Paid | Tax Assessment Tax Assessment Total Assessment is a certain percentage of the fair market value that is determined by local assessors to be the total taxable value of land and additions on the property. | Land | Improvement |
|---|---|---|---|---|
| 2025 | $996 | $25,432 | $4,212 | $21,220 |
| 2024 | $996 | $25,432 | $4,212 | $21,220 |
| 2023 | $1,002 | $25,432 | $4,212 | $21,220 |
| 2022 | $759 | $18,592 | $4,212 | $14,380 |
| 2021 | $580 | $14,200 | $2,480 | $11,720 |
| 2020 | $97 | $24,064 | $4,212 | $19,852 |
| 2019 | $99 | $24,064 | $4,212 | $19,852 |
| 2018 | $99 | $24,064 | $4,212 | $19,852 |
| 2017 | $101 | $24,064 | $4,212 | $19,852 |
| 2016 | $103 | $17,430 | $2,984 | $14,446 |
| 2015 | $41 | $17,430 | $2,984 | $14,446 |
| 2014 | $42 | $17,430 | $2,984 | $14,446 |
| 2013 | -- | $17,430 | $2,984 | $14,446 |
Source: Public Records
Map
Nearby Homes
- 2313 Dorothy Ave
- 2309 Ginny Ave
- 2317 Sharon Ave
- 2846 Walker St
- 2416 Broadmoor Dr
- 2425 Howe Ave
- 2550 Cornell Ave
- 3015 Hendrix St
- 3042 Colonial Dr
- 3009 Plantation Rd
- 2102 Somerset Ave
- 2203 Simmons Ave
- 2333 Bruce Ave
- 2404 Bruce Ave
- 3310 Albert St
- 2417 Manning Ave
- 2973 Hawthorne Dr
- 41 Ticknor Dr
- 2320 Fort Benning Rd
- 2451 Brownie Ln
- 2618 Blan St
- 2606 Blan St
- 2235 Dorothy Ave
- 2232 Beatrice Ave
- 2241 Dorothy Ave
- 2238 Beatrice Ave
- 2615 Blan St
- 2609 Blan St
- 2619 Blan St
- 2603 Blan St
- 2249 Dorothy Ave
- 2246 Beatrice Ave
- 2704 Blan St
- 2520 Blan St
- 2525 Blan St
- 2233 Beatrice Ave
- 2234 Dorothy Ave
- 2703 Blan St
- 2253 Dorothy Ave
- 2250 Beatrice Ave