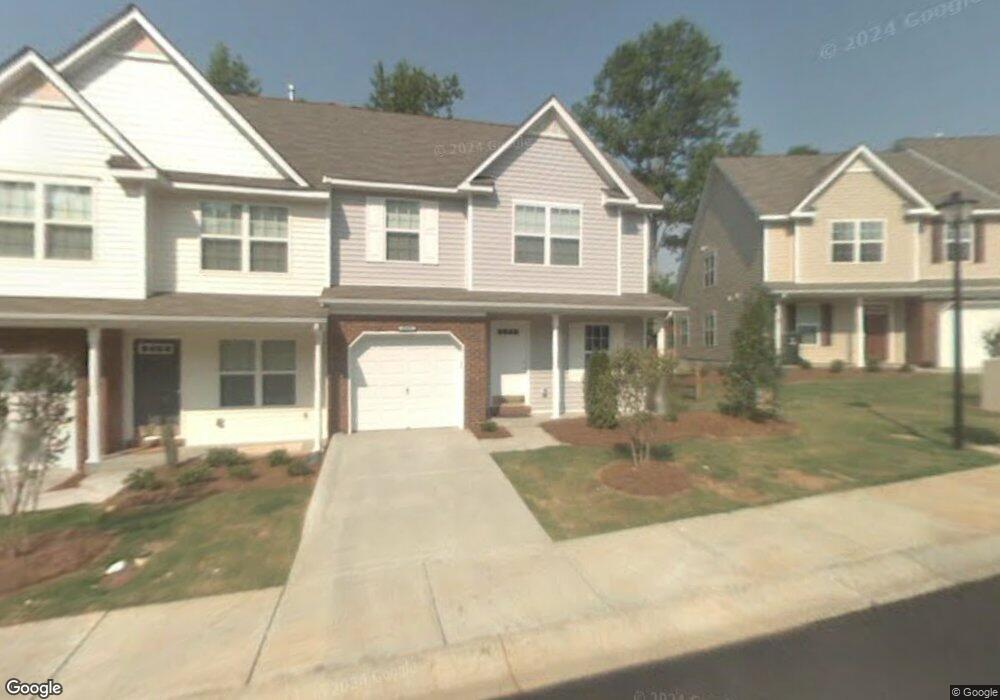
2612 Brackley Place NW Unit 2612 Concord, NC 28027
Estimated Value: $330,000 - $440,000
4
Beds
4
Baths
2,595
Sq Ft
$142/Sq Ft
Est. Value
About This Home
This home is located at 2612 Brackley Place NW Unit 2612, Concord, NC 28027 and is currently estimated at $368,924, approximately $142 per square foot. 2612 Brackley Place NW Unit 2612 is a home located in Cabarrus County with nearby schools including Carl A. Furr Elementary School, Roberta Road Middle School, and Jay M. Robinson High School.
Ownership History
Date
Name
Owned For
Owner Type
Purchase Details
Closed on
Apr 29, 2016
Sold by
Williard Erica M and Brinson Jennifer G
Bought by
Malone Dana R and Malone James A
Current Estimated Value
Home Financials for this Owner
Home Financials are based on the most recent Mortgage that was taken out on this home.
Original Mortgage
$176,739
Outstanding Balance
$141,108
Interest Rate
3.75%
Mortgage Type
FHA
Estimated Equity
$227,816
Purchase Details
Closed on
Mar 20, 2008
Sold by
Portrait Homes Oxford Commons Llc
Bought by
Williard Erica M and Brinson Jennifer G
Home Financials for this Owner
Home Financials are based on the most recent Mortgage that was taken out on this home.
Original Mortgage
$24,921
Interest Rate
5.62%
Mortgage Type
Stand Alone Second
Create a Home Valuation Report for This Property
The Home Valuation Report is an in-depth analysis detailing your home's value as well as a comparison with similar homes in the area
Home Values in the Area
Average Home Value in this Area
Purchase History
| Date | Buyer | Sale Price | Title Company |
|---|---|---|---|
| Malone Dana R | $180,000 | None Available | |
| Williard Erica M | $175,000 | None Available |
Source: Public Records
Mortgage History
| Date | Status | Borrower | Loan Amount |
|---|---|---|---|
| Open | Malone Dana R | $176,739 | |
| Previous Owner | Williard Erica M | $24,921 |
Source: Public Records
Tax History Compared to Growth
Tax History
| Year | Tax Paid | Tax Assessment Tax Assessment Total Assessment is a certain percentage of the fair market value that is determined by local assessors to be the total taxable value of land and additions on the property. | Land | Improvement |
|---|---|---|---|---|
| 2025 | $3,867 | $388,240 | $70,000 | $318,240 |
| 2024 | $3,867 | $388,240 | $70,000 | $318,240 |
| 2023 | $2,949 | $241,710 | $47,000 | $194,710 |
| 2022 | $2,949 | $241,710 | $47,000 | $194,710 |
| 2021 | $2,949 | $241,710 | $47,000 | $194,710 |
| 2020 | $2,949 | $241,710 | $47,000 | $194,710 |
| 2019 | $2,180 | $178,670 | $28,000 | $150,670 |
| 2018 | $2,144 | $178,670 | $28,000 | $150,670 |
| 2017 | $2,108 | $178,670 | $28,000 | $150,670 |
| 2016 | $1,078 | $165,700 | $28,000 | $137,700 |
| 2015 | $1,955 | $165,700 | $28,000 | $137,700 |
| 2014 | $1,955 | $165,700 | $28,000 | $137,700 |
Source: Public Records
Map
Nearby Homes
- 00 Pitts School Rd
- 2862 Walsh Dr NW Unit 99
- 2924 Darwin Trail Unit 27
- 2785 Clover Rd NW
- 2974 Plantation Rd NW Unit 6
- 2967 Plantation Rd NW Unit 83
- 406 Riverglen Dr NW
- 2848 Ridge Crossing Ct NW
- 159 Pitts School Rd NW
- 4827 Chesney St NW
- 4835 Chesney St NW
- 461 Pier Point Ct NW
- 4803 Chesney St NW
- 497 Dockside Ln NW
- 2927 Island Point Dr NW
- 4831 Turnridge Ct NW
- 5811 Monticello Dr NW
- 5807 Monticello Dr NW
- 5711 Monticello Dr NW
- 5899 Misty Forest Place NW
- 2612 Brackley Place NW
- 2616 Brackley Place NW
- 2608 Brackley Place NW
- 2620 Brackley Place NW
- 2624 Brackley Place NW
- 2604 Brackley Place NW
- 2600 Brackley Place NW
- 2628 Brackley Place NW
- 2596 Brackley Place NW
- 2607 Brackley Place NW
- 2603 Brackley Place NW Unit 1035
- 2599 Brackley Place NW
- 2595 Brackley Place NW
- 2591 Brackley Place NW
- 2591 Brackley Place NW Unit 1032
- 2587 Brackley Place NW
- 2576 Brackley Place NW
- 2640 Brackley Place NW
- 2644 Brackley Place NW
- 2644 Brackley Place NW Unit 2063