2612 Caplin St Houston, TX 77026
Eastex-Jensen NeighborhoodEstimated Value: $260,000 - $305,389
3
Beds
2
Baths
1,786
Sq Ft
$161/Sq Ft
Est. Value
About This Home
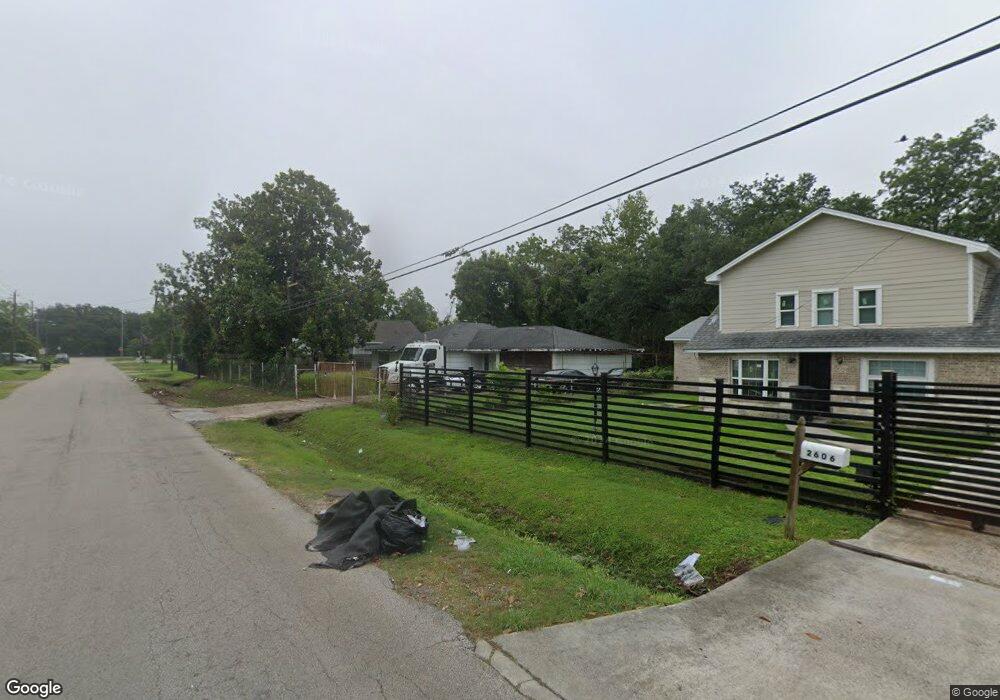
This home is located at 2612 Caplin St, Houston, TX 77026 and is currently estimated at $286,847, approximately $160 per square foot. 2612 Caplin St is a home located in Harris County with nearby schools including Roderick R. Paige Elementary School, Key Middle, and Northside High School.
Ownership History
Date
Name
Owned For
Owner Type
Purchase Details
Closed on
Apr 21, 2003
Sold by
Crockett Donna Land Wilson and Crockett Donna
Bought by
Crockrom Derrick
Current Estimated Value
Home Financials for this Owner
Home Financials are based on the most recent Mortgage that was taken out on this home.
Original Mortgage
$56,800
Interest Rate
5.65%
Mortgage Type
Purchase Money Mortgage
Create a Home Valuation Report for This Property
The Home Valuation Report is an in-depth analysis detailing your home's value as well as a comparison with similar homes in the area
Home Values in the Area
Average Home Value in this Area
Purchase History
| Date | Buyer | Sale Price | Title Company |
|---|---|---|---|
| Crockrom Derrick | -- | First American Title |
Source: Public Records
Mortgage History
| Date | Status | Borrower | Loan Amount |
|---|---|---|---|
| Previous Owner | Crockrom Derrick | $56,800 | |
| Closed | Crockrom Derrick | $10,650 |
Source: Public Records
Tax History Compared to Growth
Tax History
| Year | Tax Paid | Tax Assessment Tax Assessment Total Assessment is a certain percentage of the fair market value that is determined by local assessors to be the total taxable value of land and additions on the property. | Land | Improvement |
|---|---|---|---|---|
| 2025 | $2,069 | $316,241 | $166,050 | $150,191 |
| 2024 | $2,069 | $339,951 | $182,250 | $157,701 |
| 2023 | $2,069 | $336,874 | $182,250 | $154,624 |
| 2022 | $3,187 | $266,705 | $121,500 | $145,205 |
| 2021 | $3,067 | $219,914 | $121,500 | $98,414 |
| 2020 | $2,897 | $167,608 | $64,800 | $102,808 |
| 2019 | $2,752 | $167,608 | $64,800 | $102,808 |
| 2018 | $1,710 | $98,871 | $36,450 | $62,421 |
| 2017 | $2,500 | $98,871 | $36,450 | $62,421 |
| 2016 | $2,317 | $98,871 | $36,450 | $62,421 |
| 2015 | $1,542 | $83,294 | $26,400 | $56,894 |
| 2014 | $1,542 | $83,294 | $26,400 | $56,894 |
Source: Public Records
Map
Nearby Homes
- 2513 Melbourne St
- 3012 Melbourne St
- 2301 Caplin St
- 3016 King St
- 2301 King St
- 2503 Creston Dr
- 3206 Melbourne St
- 2710 Lynnfield St
- 2507 Creston Dr
- 2707 Lynnfield St
- 3306 Caplin St
- 5710 Cherry St
- 3401 Melbourne St
- 3224 Creston Dr
- 2015 Creston Dr
- 1909 Melbourne St
- 5514 Jensen Dr
- 5500 Jensen Dr
- 2314 Spence St
- 4008 Bennington St