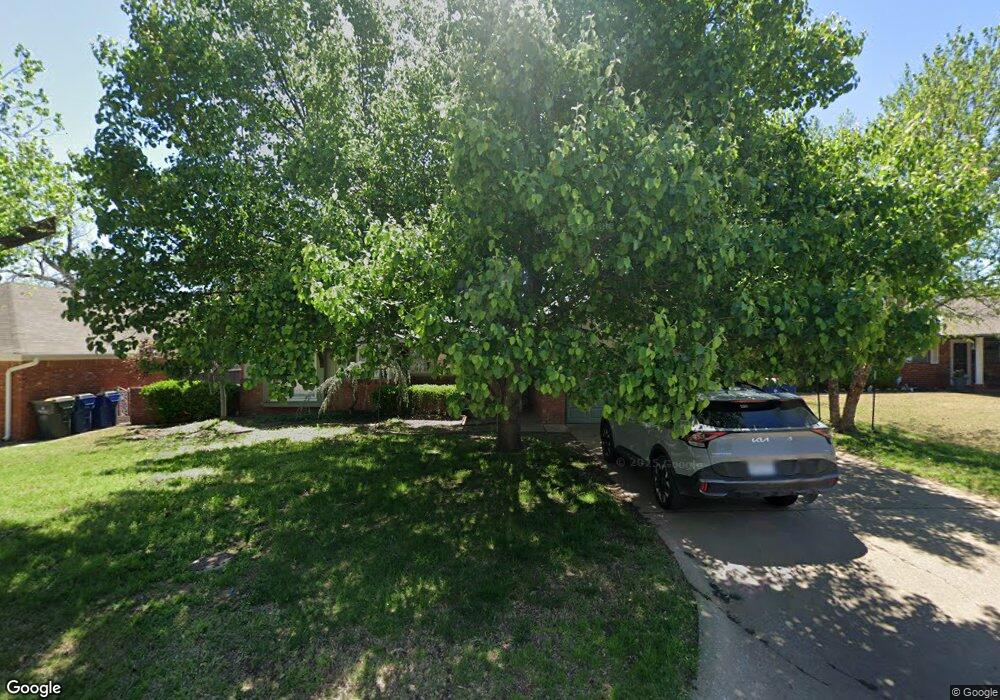
2612 Carlton Way Oklahoma City, OK 73120
Estimated Value: $276,000 - $289,932
3
Beds
2
Baths
1,749
Sq Ft
$162/Sq Ft
Est. Value
About This Home
This home is located at 2612 Carlton Way, Oklahoma City, OK 73120 and is currently estimated at $282,483, approximately $161 per square foot. 2612 Carlton Way is a home located in Oklahoma County with nearby schools including Ridgeview Elementary School, John Marshall Middle School, and John Marshall High School.
Ownership History
Date
Name
Owned For
Owner Type
Purchase Details
Closed on
Nov 15, 2017
Sold by
Slater Leonard N and Slater Lisa K
Bought by
Gautreaux John Zebedee
Current Estimated Value
Home Financials for this Owner
Home Financials are based on the most recent Mortgage that was taken out on this home.
Original Mortgage
$248,000
Interest Rate
3.85%
Mortgage Type
Credit Line Revolving
Purchase Details
Closed on
May 21, 2007
Sold by
Norick Allyson
Bought by
Gautreaux John Zebedee
Purchase Details
Closed on
Jul 31, 2002
Sold by
Farmer Ramona C
Bought by
Norick Allyson
Purchase Details
Closed on
May 22, 2002
Sold by
Sibel Lynda K and Yielding Lynda K
Bought by
Sibel Sidney L and Sibel Lynda K
Purchase Details
Closed on
Jul 17, 1998
Sold by
Farmer Mark A
Bought by
Farmer Ramona C
Purchase Details
Closed on
Sep 6, 1995
Sold by
Farmer Ramona C
Bought by
Farmer Mark A
Create a Home Valuation Report for This Property
The Home Valuation Report is an in-depth analysis detailing your home's value as well as a comparison with similar homes in the area
Home Values in the Area
Average Home Value in this Area
Purchase History
| Date | Buyer | Sale Price | Title Company |
|---|---|---|---|
| Gautreaux John Zebedee | $310,000 | American Eagle Title Group | |
| Gautreaux John Zebedee | $144,000 | Capitol Abstract & Title Co | |
| Norick Allyson | $116,000 | American Guaranty Title Co | |
| Sibel Sidney L | -- | -- | |
| Farmer Ramona C | $89,000 | First Amer Title & Trust Co | |
| Farmer Mark A | -- | -- |
Source: Public Records
Mortgage History
| Date | Status | Borrower | Loan Amount |
|---|---|---|---|
| Closed | Gautreaux John Zebedee | $248,000 |
Source: Public Records
Tax History Compared to Growth
Tax History
| Year | Tax Paid | Tax Assessment Tax Assessment Total Assessment is a certain percentage of the fair market value that is determined by local assessors to be the total taxable value of land and additions on the property. | Land | Improvement |
|---|---|---|---|---|
| 2024 | $2,898 | $25,336 | $3,799 | $21,537 |
| 2023 | $2,898 | $24,130 | $3,733 | $20,397 |
| 2022 | $2,649 | $22,981 | $3,040 | $19,941 |
| 2021 | $2,449 | $21,887 | $3,077 | $18,810 |
| 2020 | $2,300 | $20,845 | $3,201 | $17,644 |
| 2019 | $2,207 | $19,923 | $3,100 | $16,823 |
| 2018 | $1,994 | $18,975 | $0 | $0 |
| 2017 | $1,867 | $19,029 | $2,654 | $16,375 |
| 2016 | $1,822 | $18,479 | $2,654 | $15,825 |
| 2015 | $1,807 | $18,279 | $2,654 | $15,625 |
| 2014 | $1,747 | $17,759 | $2,609 | $15,150 |
Source: Public Records
Map
Nearby Homes
- 2601 Chaucer Dr
- 9800 Mahler Place
- 2608 Kings Way
- 2512 Ashley Dr
- 2604 Keats Place
- 2600 Keats Place
- 2429 Barclay Rd
- 2802 W Britton Rd
- 2800 Kerry Ln
- 2365 W Britton Rd
- 9801 Ashley Place
- 2409 Sorrento Dr
- 2344 W Britton Rd
- 2912 Carlton Way
- 2413 Milano Ln
- 2327 Sorrento Dr
- 10508 Whitehaven Rd
- 2020 Hasley Dr
- 2236 Carlton Way
- 10504 Ridgeview Dr
- 2616 Carlton Way
- 2608 Carlton Way
- 2613 Chaucer Dr
- 2620 Carlton Way
- 2609 Chaucer Dr
- 2604 Carlton Way
- 2617 Chaucer Dr
- 2613 Carlton Way
- 2605 Chaucer Dr
- 2617 Carlton Way
- 2609 Carlton Way
- 2624 Carlton Way
- 2621 Carlton Way
- 2600 Carlton Way
- 2605 Carlton Way
- 2625 Chaucer Dr
- 2625 Carlton Way
- 2628 Carlton Way
- 2601 Carlton Way
- 2629 Chaucer Dr