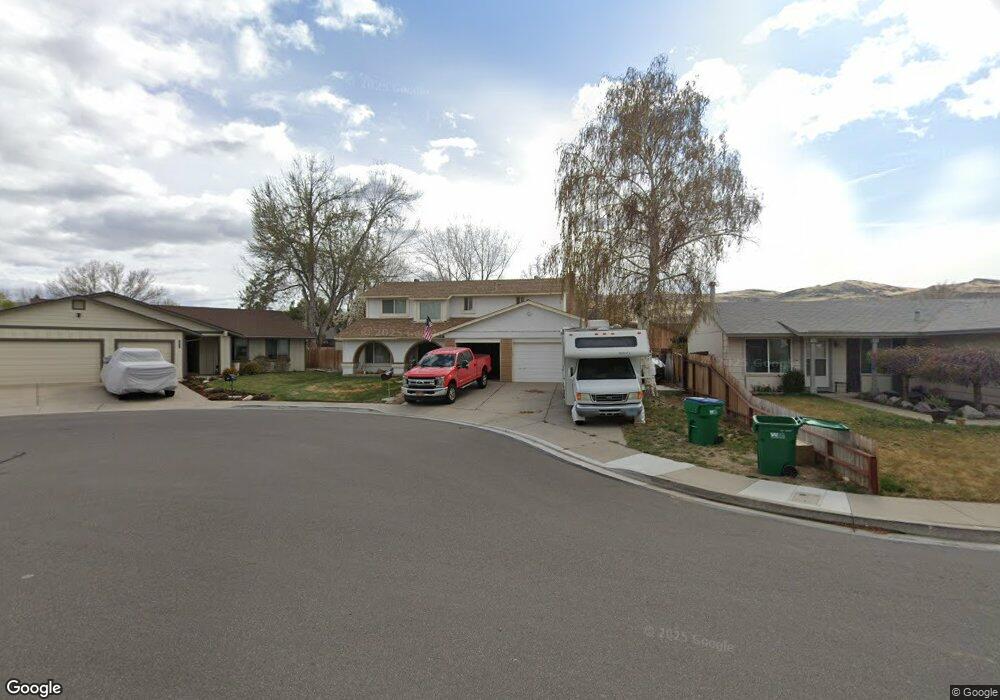
2612 Drexel Way Sparks, NV 89434
Reed NeighborhoodEstimated Value: $516,000 - $532,000
4
Beds
3
Baths
2,174
Sq Ft
$241/Sq Ft
Est. Value
About This Home
This home is located at 2612 Drexel Way, Sparks, NV 89434 and is currently estimated at $524,407, approximately $241 per square foot. 2612 Drexel Way is a home located in Washoe County with nearby schools including Lloyd Diedrichsen Elementary School, Lou Mendive Middle School, and Edward C Reed High School.
Ownership History
Date
Name
Owned For
Owner Type
Purchase Details
Closed on
May 7, 2018
Sold by
Marshall Victor B and Marshall Laura A
Bought by
Marshall Victor Bryan and Marshall Laura Anne
Current Estimated Value
Purchase Details
Closed on
Apr 19, 2006
Sold by
Marshall Victor B and Marshall Laura A
Bought by
Marshall Victor Bryan and Marshall Laura Anne
Purchase Details
Closed on
Mar 8, 2006
Sold by
Marshall Victor Bryan and Marshall Laura Anne
Bought by
Marshall Victor Bryan and Marshall Laura Anne
Create a Home Valuation Report for This Property
The Home Valuation Report is an in-depth analysis detailing your home's value as well as a comparison with similar homes in the area
Home Values in the Area
Average Home Value in this Area
Purchase History
| Date | Buyer | Sale Price | Title Company |
|---|---|---|---|
| Marshall Victor Bryan | -- | None Available | |
| Marshall Victor Bryan | -- | None Available | |
| Marshall Victor Bryan | -- | None Available |
Source: Public Records
Tax History Compared to Growth
Tax History
| Year | Tax Paid | Tax Assessment Tax Assessment Total Assessment is a certain percentage of the fair market value that is determined by local assessors to be the total taxable value of land and additions on the property. | Land | Improvement |
|---|---|---|---|---|
| 2026 | $1,658 | $77,734 | $36,890 | $40,844 |
| 2025 | $2,155 | $78,640 | $36,120 | $42,520 |
| 2024 | $2,155 | $77,071 | $33,215 | $43,856 |
| 2023 | $2,093 | $77,494 | $35,175 | $42,319 |
| 2022 | $2,033 | $62,581 | $26,740 | $35,841 |
| 2021 | $1,974 | $58,057 | $21,735 | $36,322 |
| 2020 | $1,915 | $57,743 | $20,720 | $37,023 |
| 2019 | $1,860 | $57,292 | $20,720 | $36,572 |
| 2018 | $1,805 | $50,821 | $14,455 | $36,366 |
| 2017 | $1,752 | $50,721 | $13,720 | $37,001 |
| 2016 | $1,713 | $50,333 | $12,250 | $38,083 |
| 2015 | $1,711 | $48,900 | $10,325 | $38,575 |
| 2014 | $1,661 | $46,527 | $9,030 | $37,497 |
| 2013 | -- | $44,235 | $6,860 | $37,375 |
Source: Public Records
Map
Nearby Homes
- 1675 Round Mountain Cir
- 1688 Round Mountain Cir
- 2688 Laguna Way
- 2252 Sycamore Glen Dr
- 2159 Meritage Dr
- 3222 Myles Dr
- 2119 Avella Dr
- 3127 Montezuma Way
- 3253 Clan Alpine Dr
- 2407 Sunny Slope Dr Unit 1
- 2535 Tuscan Way
- 1770 Burnside Dr
- 1960 Vicenza Dr
- 3345 Groom Way
- 2679 Sycamore Glen Dr Unit 4
- 1990 Fargo Way
- 2002 Wabash Cir
- 2552 Cosimo Ct
- 1280 O'Callaghan Dr
- 2524 Garzoni Dr
- 2572 Drexel Way
- 2652 Drexel Way
- 1846 Dover Ct
- 2562 Drexel Way
- 1852 Dover Ct
- 2672 Drexel Way
- 1840 Dover Ct
- 1857 Fieldcrest Dr
- 1867 Fieldcrest Dr
- 2613 Drexel Way
- 1847 Fieldcrest Dr
- 2573 Drexel Way
- 1877 Fieldcrest Dr
- 2653 Drexel Way
- 2563 Drexel Way
- 1837 Fieldcrest Dr
- 1858 Dover Ct
- 1887 Fieldcrest Dr
- 2523 Drexel Way
- 1827 Fieldcrest Dr