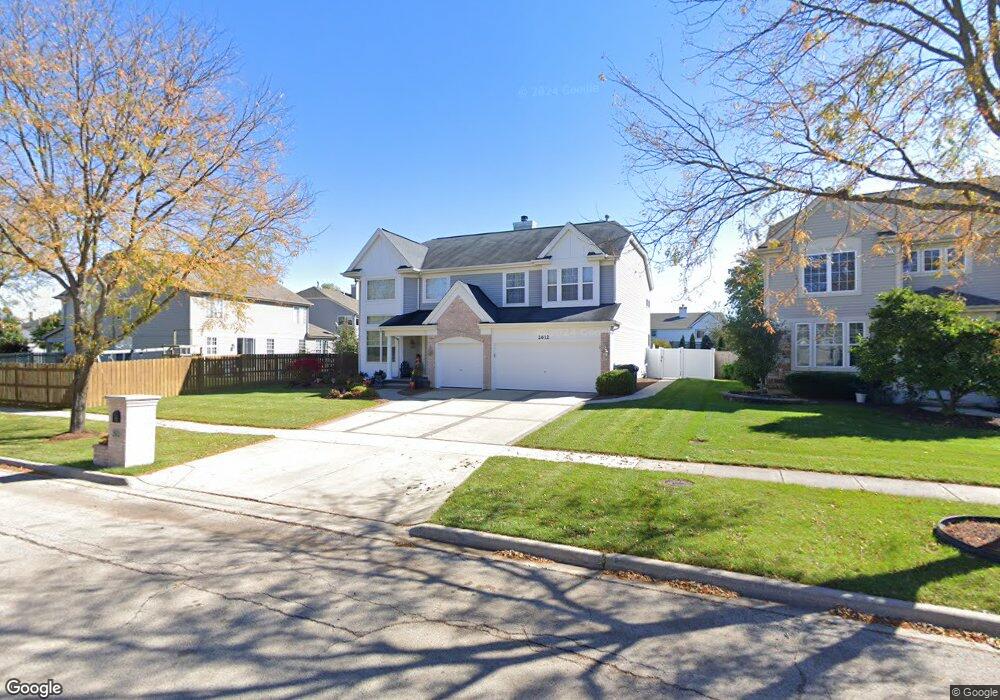
2612 Havens Dr West Chicago, IL 60185
Cornerstone Lakes NeighborhoodEstimated Value: $625,000 - $650,000
3
Beds
3
Baths
3,000
Sq Ft
$211/Sq Ft
Est. Value
About This Home
This home is located at 2612 Havens Dr, West Chicago, IL 60185 and is currently estimated at $634,296, approximately $211 per square foot. 2612 Havens Dr is a home located in DuPage County with nearby schools including Norton Creek Elementary School, Wredling Middle School, and St Charles East High School.
Ownership History
Date
Name
Owned For
Owner Type
Purchase Details
Closed on
Apr 25, 2013
Sold by
Carr Lawrence A and Falko Carr Lisa R
Bought by
Carr Lawrence A and Falko Carr Lisa R
Current Estimated Value
Home Financials for this Owner
Home Financials are based on the most recent Mortgage that was taken out on this home.
Original Mortgage
$399,331
Outstanding Balance
$284,741
Interest Rate
3.62%
Mortgage Type
FHA
Estimated Equity
$349,555
Purchase Details
Closed on
May 19, 2010
Sold by
Mazzola John and Mazzola Rosalia
Bought by
Carr Lawrence A and Carr Lisa R Falko
Home Financials for this Owner
Home Financials are based on the most recent Mortgage that was taken out on this home.
Original Mortgage
$411,454
Interest Rate
5.12%
Mortgage Type
FHA
Purchase Details
Closed on
Dec 1, 2001
Sold by
Concord At Cornerstone Lakes Llc
Bought by
Mazzola John V and Mazzola Rosalia
Home Financials for this Owner
Home Financials are based on the most recent Mortgage that was taken out on this home.
Original Mortgage
$301,000
Interest Rate
5.87%
Create a Home Valuation Report for This Property
The Home Valuation Report is an in-depth analysis detailing your home's value as well as a comparison with similar homes in the area
Home Values in the Area
Average Home Value in this Area
Purchase History
| Date | Buyer | Sale Price | Title Company |
|---|---|---|---|
| Carr Lawrence A | -- | Citywide Title Corporation | |
| Carr Lawrence A | $417,000 | Multiple | |
| Mazzola John V | $327,500 | -- |
Source: Public Records
Mortgage History
| Date | Status | Borrower | Loan Amount |
|---|---|---|---|
| Open | Carr Lawrence A | $399,331 | |
| Closed | Carr Lawrence A | $411,454 | |
| Previous Owner | Mazzola John V | $301,000 |
Source: Public Records
Tax History Compared to Growth
Tax History
| Year | Tax Paid | Tax Assessment Tax Assessment Total Assessment is a certain percentage of the fair market value that is determined by local assessors to be the total taxable value of land and additions on the property. | Land | Improvement |
|---|---|---|---|---|
| 2024 | -- | $170,113 | $41,762 | $128,351 |
| 2023 | $11,890 | $154,340 | $37,890 | $116,450 |
| 2022 | $11,320 | $143,430 | $35,210 | $108,220 |
| 2021 | $10,821 | $136,150 | $33,420 | $102,730 |
| 2020 | $11,354 | $140,500 | $34,490 | $106,010 |
| 2019 | $11,017 | $135,490 | $33,260 | $102,230 |
| 2018 | $10,932 | $133,660 | $32,810 | $100,850 |
| 2017 | $10,418 | $128,330 | $31,500 | $96,830 |
| 2016 | $10,757 | $122,580 | $30,090 | $92,490 |
| 2015 | $10,446 | $116,030 | $28,480 | $87,550 |
| 2014 | $10,080 | $113,090 | $27,760 | $85,330 |
| 2013 | $10,242 | $113,690 | $28,420 | $85,270 |
Source: Public Records
Map
Nearby Homes
- 2652 Bainbridge Blvd
- 2420 Barnhart St
- 3753 Queen Anne Ct
- 4020 Faith Ln
- 4012 Faith Ln
- 4015 Faith Ln
- 3706 Royal Fox Dr
- 3701 King Charles Ln
- 2602 Majestic Oaks Ln
- 4057 Pheasant Ct
- 531 Pheasant Trail
- 363 Bridgeview Ct
- GRANT Plan at Charlestowne Lakes
- MONROE Plan at Charlestowne Lakes
- ASHTON Plan at Charlestowne Lakes
- 432 Lakeshore Ct
- 434 Lakeshore Ct
- 436 Lakeshore Ct
- 438 Lakeshore Ct
- 440 Lakeshore Ct
- 2622 Havens Dr
- 2560 Bainbridge Blvd
- 2550 Bainbridge Blvd
- 2632 Havens Dr
- 2613 Havens Dr
- 2603 Havens Dr
- 2540 Bainbridge Blvd
- 2633 Havens Dr
- 3044 Blanchard Ln
- 2642 Havens Dr
- 3004 Blanchard Ln
- 3022 Blanchard Ln
- 3010 Blanchard Ln
- 2998 Blanchard Ln
- 2551 Bainbridge Blvd
- 2992 Blanchard Ln
- 2652 Havens Dr
- 2541 Bainbridge Blvd
- 2607 Bainbridge Blvd
- 2644 Bainbridge Blvd