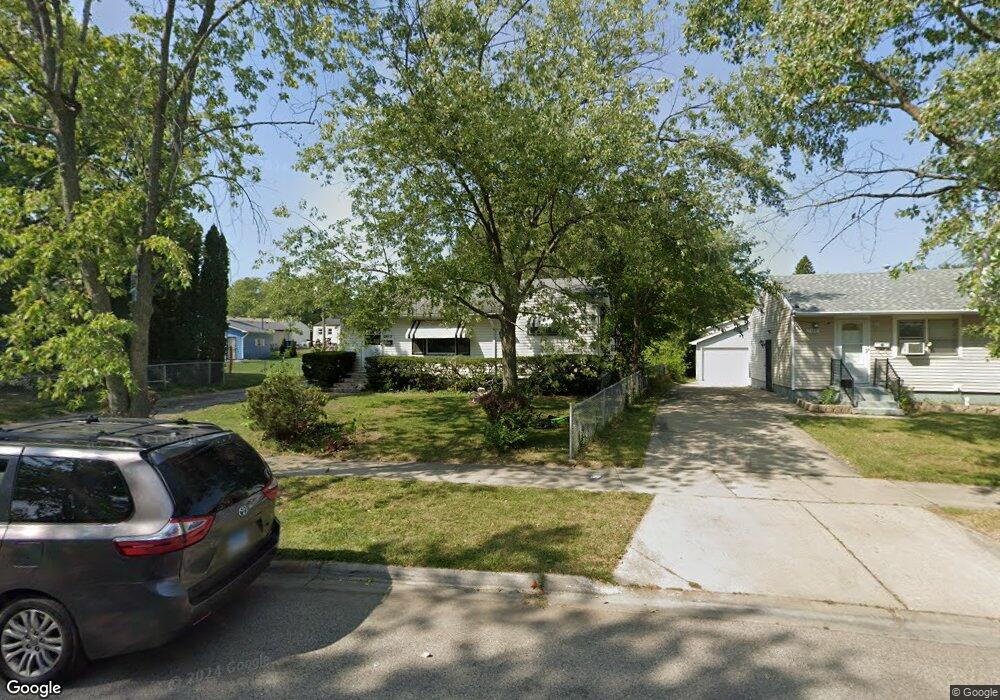
2612 Illini Rd Waukegan, IL 60087
Lake Cogardens NeighborhoodEstimated Value: $231,000 - $258,000
3
Beds
1
Bath
1,176
Sq Ft
$209/Sq Ft
Est. Value
About This Home
This home is located at 2612 Illini Rd, Waukegan, IL 60087 and is currently estimated at $245,938, approximately $209 per square foot. 2612 Illini Rd is a home located in Lake County with nearby schools including Oakdale Elementary School, Miguel Juarez Middle School, and Waukegan High School.
Ownership History
Date
Name
Owned For
Owner Type
Purchase Details
Closed on
Jun 22, 2022
Sold by
Nikodinovic Fishman Lily
Bought by
Johnson Mayra and Johnson Randall C
Current Estimated Value
Home Financials for this Owner
Home Financials are based on the most recent Mortgage that was taken out on this home.
Original Mortgage
$262,163
Outstanding Balance
$250,517
Interest Rate
5.78%
Estimated Equity
-$4,579
Purchase Details
Closed on
Aug 31, 2018
Sold by
Nevarez Juan and Nevarez Rosa
Bought by
Nevarez Juan
Home Financials for this Owner
Home Financials are based on the most recent Mortgage that was taken out on this home.
Original Mortgage
$50,500
Interest Rate
4.5%
Mortgage Type
New Conventional
Purchase Details
Closed on
Jul 12, 1999
Sold by
Groat David L and Groat Susan K
Bought by
Nevarez Juan and Estrada Rosa
Home Financials for this Owner
Home Financials are based on the most recent Mortgage that was taken out on this home.
Original Mortgage
$106,084
Interest Rate
7.68%
Mortgage Type
FHA
Create a Home Valuation Report for This Property
The Home Valuation Report is an in-depth analysis detailing your home's value as well as a comparison with similar homes in the area
Home Values in the Area
Average Home Value in this Area
Purchase History
| Date | Buyer | Sale Price | Title Company |
|---|---|---|---|
| Johnson Mayra | $267,000 | Citywide Title | |
| Nevarez Juan | -- | Chicago Title | |
| Nevarez Juan | $107,000 | -- |
Source: Public Records
Mortgage History
| Date | Status | Borrower | Loan Amount |
|---|---|---|---|
| Open | Johnson Mayra | $262,163 | |
| Previous Owner | Nevarez Juan | $50,500 | |
| Previous Owner | Nevarez Juan | $106,084 |
Source: Public Records
Tax History Compared to Growth
Tax History
| Year | Tax Paid | Tax Assessment Tax Assessment Total Assessment is a certain percentage of the fair market value that is determined by local assessors to be the total taxable value of land and additions on the property. | Land | Improvement |
|---|---|---|---|---|
| 2024 | $5,428 | $72,578 | $9,634 | $62,944 |
| 2023 | $5,428 | $65,567 | $8,704 | $56,863 |
| 2022 | $4,938 | $56,511 | $8,293 | $48,218 |
| 2021 | $4,525 | $49,405 | $7,180 | $42,225 |
| 2020 | $4,537 | $46,027 | $6,689 | $39,338 |
| 2019 | $4,514 | $42,176 | $6,129 | $36,047 |
| 2018 | $3,560 | $33,919 | $7,807 | $26,112 |
| 2017 | $3,415 | $30,009 | $6,907 | $23,102 |
| 2016 | $3,103 | $26,077 | $6,002 | $20,075 |
| 2015 | $2,929 | $23,339 | $5,372 | $17,967 |
| 2014 | $3,275 | $24,894 | $5,537 | $19,357 |
| 2012 | $4,278 | $26,971 | $6,000 | $20,971 |
Source: Public Records
Map
Nearby Homes
- 1913 Chippewa Rd
- 2440 W Cheyenne Rd
- 2715 W Greenwood Ave
- 2713 Varonen Ave
- 2928 W Country Club Ave
- 3000 W Country Club Ave
- 2946 W Country Club Ave
- 2207 Williamsburg Dr
- 2705 Dana Ave
- 3320 Sunset Ave
- 2810 W Atlantic Ave
- 2708 Dana Ave
- 12352 W Atlantic Ave
- 2008 Harding Ave
- 2350 N Lewis Ave
- 2009 Harding Ave
- 3032 W Vermont Ave
- 2813 Theresa Ave
- 36955 N Garrick Ave
- 12312 W Audrey Ave
- 2608 Illini Rd Unit 2
- 2616 Illini Rd
- 2611 Menominee Rd Unit 2
- 2607 Menominee Rd
- 2615 Menominee Rd
- 2622 Illini Rd
- 2600 Illini Rd
- 2034 N Mcaree Rd
- 2613 Illini Rd
- 2605 Illini Rd
- 2601 Menominee Rd
- 2626 Illini Rd
- 2625 Menominee Rd
- 2014 N Mcaree Rd
- 2617 Illini Rd
- 2630 Illini Rd
- 2629 Menominee Rd
- 2612 Menominee Rd
- 2008 N Mcaree Rd Unit 2