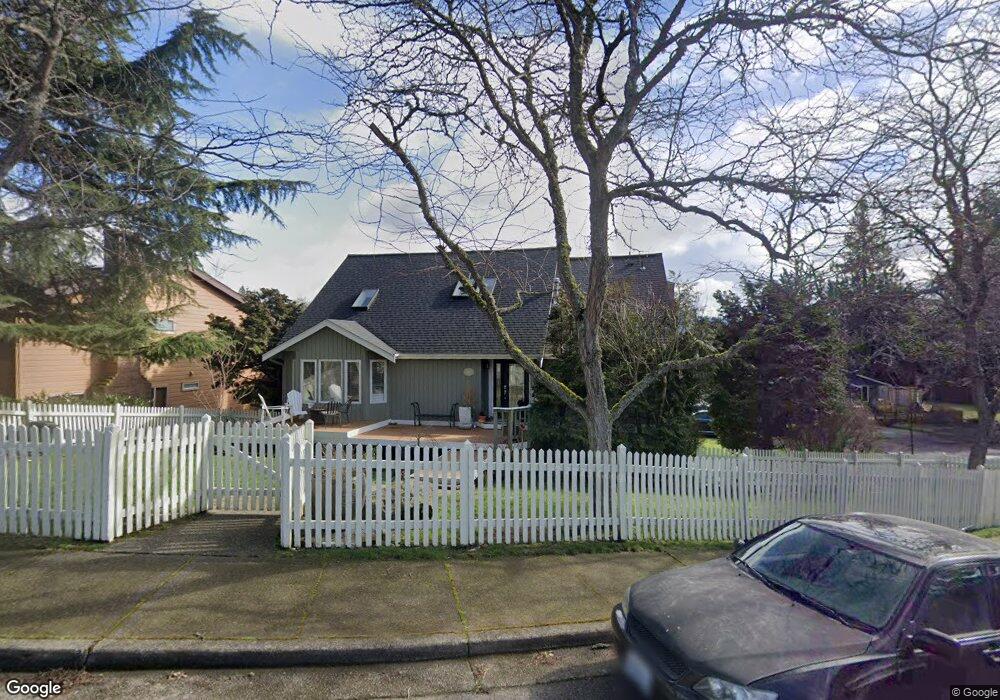
2612 Lakeridge Ln Bellingham, WA 98226
Alabama Hill NeighborhoodEstimated Value: $850,531 - $920,000
3
Beds
3
Baths
1,966
Sq Ft
$450/Sq Ft
Est. Value
About This Home
This home is located at 2612 Lakeridge Ln, Bellingham, WA 98226 and is currently estimated at $885,383, approximately $450 per square foot. 2612 Lakeridge Ln is a home located in Whatcom County with nearby schools including Silver Beach Elementary School, Whatcom Middle School, and Squalicum High School.
Ownership History
Date
Name
Owned For
Owner Type
Purchase Details
Closed on
Sep 20, 2001
Sold by
Roach Owen
Bought by
Crosier Matthew B and Crosier Lisa A
Current Estimated Value
Home Financials for this Owner
Home Financials are based on the most recent Mortgage that was taken out on this home.
Original Mortgage
$189,050
Outstanding Balance
$73,290
Interest Rate
6.91%
Estimated Equity
$812,094
Purchase Details
Closed on
May 30, 2001
Sold by
Browning Eva J and Browning Gordon D
Bought by
Roach Owen M
Purchase Details
Closed on
Feb 9, 1999
Sold by
Browning Eva J and Henifin Eva
Bought by
Browning Gordon D and Browning Eva J
Home Financials for this Owner
Home Financials are based on the most recent Mortgage that was taken out on this home.
Original Mortgage
$151,000
Interest Rate
6.43%
Create a Home Valuation Report for This Property
The Home Valuation Report is an in-depth analysis detailing your home's value as well as a comparison with similar homes in the area
Home Values in the Area
Average Home Value in this Area
Purchase History
| Date | Buyer | Sale Price | Title Company |
|---|---|---|---|
| Crosier Matthew B | $199,000 | Whatcom Land Title | |
| Roach Owen M | -- | Whatcom Land Title | |
| Browning Gordon D | -- | Island Title Company |
Source: Public Records
Mortgage History
| Date | Status | Borrower | Loan Amount |
|---|---|---|---|
| Open | Crosier Matthew B | $189,050 | |
| Previous Owner | Browning Gordon D | $151,000 |
Source: Public Records
Tax History Compared to Growth
Tax History
| Year | Tax Paid | Tax Assessment Tax Assessment Total Assessment is a certain percentage of the fair market value that is determined by local assessors to be the total taxable value of land and additions on the property. | Land | Improvement |
|---|---|---|---|---|
| 2024 | $6,620 | $814,994 | $303,899 | $511,095 |
| 2023 | $6,620 | $850,830 | $317,262 | $533,568 |
| 2022 | $5,729 | $746,343 | $278,300 | $468,043 |
| 2021 | $4,941 | $616,812 | $230,000 | $386,812 |
| 2020 | $4,777 | $502,069 | $186,924 | $315,145 |
| 2019 | $4,273 | $469,106 | $174,780 | $294,326 |
| 2018 | $4,422 | $420,759 | $156,780 | $263,979 |
| 2017 | $3,846 | $372,292 | $138,720 | $233,572 |
| 2016 | $3,519 | $338,366 | $126,240 | $212,126 |
| 2015 | $3,363 | $322,314 | $120,000 | $202,314 |
| 2014 | -- | $298,070 | $92,880 | $205,190 |
| 2013 | -- | $285,372 | $90,000 | $195,372 |
Source: Public Records
Map
Nearby Homes
- 2612 Birch St
- 3700 Alabama St Unit 316
- 4020 Academy St
- 2209 W Birch St
- 4055 Springland Ct
- 2104 Birch Cir Unit 5C
- 3153 Chandler Pkwy
- 3155 Chandler Pkwy
- 3159 Chandler Pkwy
- 4414 Alice St
- 2735 Michigan St
- 4431 Alice St
- 3527 Sussex Dr
- 2316 Xenia St
- 2602 Woburn St
- 2409 Xenia St
- 4000 Flynn St Unit 50
- 4000 Flynn St Unit 107
- 2138 Woburn St
- 2325 Valencia St
- 2618 Lakeridge Ln
- 2608 Lakeridge Ln
- 2622 Lakeridge Ln
- 2604 Lakeridge Ln
- 2611 Lakeridge Ln
- 2626 Lakeridge Ln
- 2603 Lakeridge Ln
- 2605 Lakeridge Ln
- 2615 Lakeridge Ln
- 2600 Lakeridge Ln
- 2601 Lakeridge Ln
- 2621 Lakeridge Ln
- 2609 Lakeridge Ln
- 3700 E Connecticut St
- 2607 Lakeridge Ln
- 2701 Lakeridge Ln
- 2700 Lakeridge Ln
- 2706 Lakeridge Ln
- 3701 E Connecticut St
- 2523 Fir St