


2612 NE 53rd St Vancouver, WA 98663
West Minnehaha NeighborhoodEstimated payment $3,641/month
Highlights
- RV Access or Parking
- 0.84 Acre Lot
- Private Yard
- View of Trees or Woods
- Secluded Lot
- 4-minute walk to West Minnehaha Neighborhood Park
About This Home
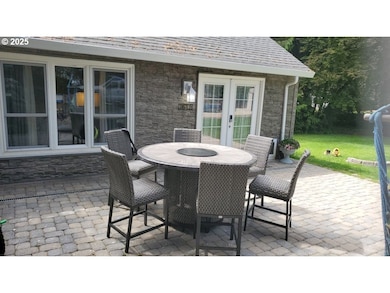
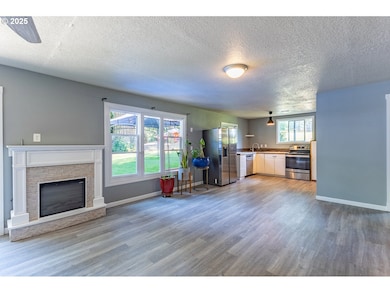
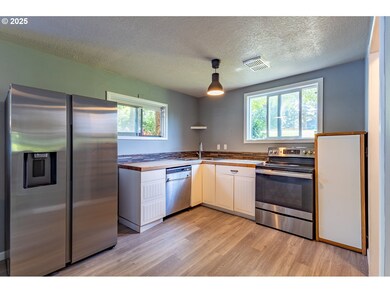
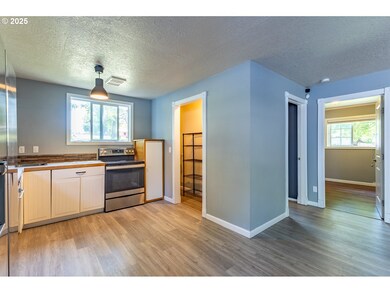
Come enjoy your own little slice of forested serenity on this .84 acre park-like lot. This adorable cottage style home has been lovingly updated throughout. The open great-room plan incorporates trendy grey laminate flooring and paint, designer light fixtures, and a cozy electric fireplace. The open kitchen features butcher-block counters, stainless steel appliances and a roomy pantry. On the main level you’ll find 2 bedrooms, one with a private entrance to the bathroom that incudes new tiled flooring and a bathtub / shower combo, a storage room, and a large laundry room with built-in storage. Upstairs is complete with a bedroom and loft area. Outside you’ll love the huge and private yard w/serene trees, raised garden beds, a beautiful paver stone patio, and a covered carport with storage outbuilding. Don’t miss: tankless hot water heater, RV parking. This property is zoned R9 and is being sold at the same time as the adjoining property MLS# 503938251. Buy one or both, combined together would be 1.39 acres, perfect for low density residential development. Financing incentive available.
Listing Agent
Coldwell Banker Bain Brokerage Phone: 360-892-7325 License #71184 Listed on: 06/05/2025

Home Details
Home Type
- Single Family
Est. Annual Taxes
- $4,043
Year Built
- Built in 1952
Lot Details
- 0.84 Acre Lot
- Secluded Lot
- Level Lot
- Landscaped with Trees
- Private Yard
- Property is zoned R9
Parking
- 1 Car Detached Garage
- Carport
- RV Access or Parking
Home Design
- Cottage
- Slab Foundation
- Composition Roof
- Metal Siding
Interior Spaces
- 1,316 Sq Ft Home
- 2-Story Property
- Ceiling Fan
- Fireplace
- Double Pane Windows
- Vinyl Clad Windows
- Family Room
- Living Room
- Dining Room
- First Floor Utility Room
- Laminate Flooring
- Views of Woods
Kitchen
- Free-Standing Range
- Plumbed For Ice Maker
- Dishwasher
- Stainless Steel Appliances
- Solid Surface Countertops
- Disposal
Bedrooms and Bathrooms
- 3 Bedrooms
- 1 Full Bathroom
- Soaking Tub
Laundry
- Laundry Room
- Washer and Dryer
Accessible Home Design
- Accessibility Features
- Minimal Steps
Outdoor Features
- Patio
- Outbuilding
Schools
- Minnehaha Elementary School
- Jason Lee Middle School
- Hudsons Bay High School
Utilities
- Window Unit Cooling System
- Heating System Mounted To A Wall or Window
Community Details
- No Home Owners Association
- Minnehaha Acres Subdivision
Listing and Financial Details
- Assessor Parcel Number 100855000
Map
Home Values in the Area
Average Home Value in this Area
Tax History
| Year | Tax Paid | Tax Assessment Tax Assessment Total Assessment is a certain percentage of the fair market value that is determined by local assessors to be the total taxable value of land and additions on the property. | Land | Improvement |
|---|---|---|---|---|
| 2025 | $4,043 | $422,049 | $288,241 | $133,808 |
| 2024 | $3,916 | $413,891 | $288,241 | $125,650 |
| 2023 | $3,859 | $418,553 | $288,241 | $130,312 |
| 2022 | $3,554 | $414,070 | $288,241 | $125,829 |
| 2021 | $2,990 | $355,269 | $246,360 | $108,909 |
| 2020 | $2,405 | $281,662 | $281,662 | $0 |
| 2019 | $2,214 | $234,719 | $234,719 | $0 |
| 2018 | $2,312 | $223,765 | $0 | $0 |
| 2017 | $2,055 | $194,034 | $0 | $0 |
| 2016 | $1,870 | $179,951 | $0 | $0 |
| 2015 | $1,748 | $156,479 | $0 | $0 |
| 2014 | -- | $138,257 | $0 | $0 |
| 2013 | -- | $117,321 | $0 | $0 |
Property History
| Date | Event | Price | List to Sale | Price per Sq Ft |
|---|---|---|---|---|
| 09/02/2025 09/02/25 | Price Changed | $625,000 | -10.7% | $475 / Sq Ft |
| 06/05/2025 06/05/25 | For Sale | $699,900 | -- | $532 / Sq Ft |
Purchase History
| Date | Type | Sale Price | Title Company |
|---|---|---|---|
| Interfamily Deed Transfer | -- | Columbia Title Agency | |
| Warranty Deed | $134,719 | Columbia Title Agency | |
| Warranty Deed | -- | Charter Title Corporation | |
| Contract Of Sale | $107,000 | -- |
Mortgage History
| Date | Status | Loan Amount | Loan Type |
|---|---|---|---|
| Closed | $139,000 | Seller Take Back | |
| Previous Owner | $97,000 | No Value Available |
Source: Regional Multiple Listing Service (RMLS)
MLS Number: 632243802
APN: 100855-000
Disclaimer: Certain information contained herein is derived from information provided by parties other than Homes.com. All information provided is deemed reliable, but is not guaranteed to be accurate and should be independently verified.
![]() The content relating to real estate for sale on this web site comes in part from the IDX program of the RMLS™ of Portland, Oregon. Real estate listings held by brokerage firms other than Ten-X are marked with the RMLS™ logo, and detailed information about these properties includes the names of the listing brokers. Listing content is copyright © 2025 RMLS™, Portland, Oregon. Some properties which appear for sale on this web site may subsequently have sold or may no longer be available. All information provided is deemed reliable but is not guaranteed and should be independently verified.
The content relating to real estate for sale on this web site comes in part from the IDX program of the RMLS™ of Portland, Oregon. Real estate listings held by brokerage firms other than Ten-X are marked with the RMLS™ logo, and detailed information about these properties includes the names of the listing brokers. Listing content is copyright © 2025 RMLS™, Portland, Oregon. Some properties which appear for sale on this web site may subsequently have sold or may no longer be available. All information provided is deemed reliable but is not guaranteed and should be independently verified.
- 2608 NE 53rd St
- 2603 NE 53rd St
- 2716 NE 53rd St
- 5214 NE 25th Place
- 5102 NE 28th Ave
- 2526 NE 51st St
- 2524 NE 51st St
- 2520 NE 51st St
- 5015 NE 28th Ave
- 4929 NE 24th Ave
- 2507 NE 59th St
- 3010 NE 49th St
- 3001 NE 59th St
- 5701 NE St Johns Rd Unit 86
- 5701 NE St Johns Rd Unit 4
- 5701 NE St Johns Rd Unit 36
- 5701 NE St Johns Rd Unit 60
- 5701 NE St Johns Rd Unit 24
- 3602 NE 54th St
- 2714 NE 42nd Cir
- 6208 NE 17th Ave
- 2911 NE 68th St
- 4705 NE Leverich Pkwy
- 4820 NE Hazel Dell Ave
- 301 NE 45th St
- 7301 NE 13th Ave
- 7714 NE 39th Ct
- 3100 Falk Rd
- 4500 Nicholson Rd
- 2301 NE 81st St
- 7900 NE 18th Ave
- 2920 Falk Rd
- 2615 Neals Ln
- 2600 T St
- 2812 Falk Rd
- 4710 Plomondon St
- 1103 NE 83rd St
- 6008 NE 64th St
- 2011 Brandt Rd
- 3009 NE 57th Ave