2612 North Ave Unit E16 Bridgeport, CT 06604
Brooklawn-Saint Vincent NeighborhoodEstimated Value: $297,622 - $316,000
2
Beds
2
Baths
1,040
Sq Ft
$297/Sq Ft
Est. Value
About This Home
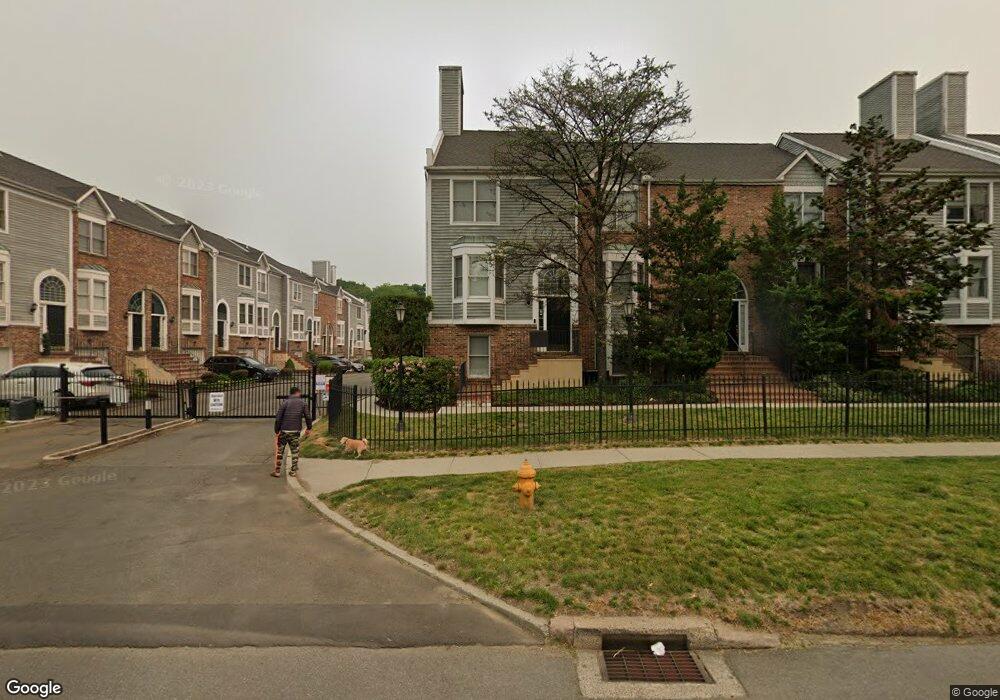
This home is located at 2612 North Ave Unit E16, Bridgeport, CT 06604 and is currently estimated at $309,156, approximately $297 per square foot. 2612 North Ave Unit E16 is a home located in Fairfield County with nearby schools including Geraldine Johnson School, Bassick High School, and Park City Prep Charter School.
Ownership History
Date
Name
Owned For
Owner Type
Purchase Details
Closed on
Nov 5, 2008
Sold by
Felner Brian
Bought by
Colligan Jessica and Colligan Marguerite
Current Estimated Value
Home Financials for this Owner
Home Financials are based on the most recent Mortgage that was taken out on this home.
Original Mortgage
$115,500
Outstanding Balance
$75,817
Interest Rate
6.08%
Estimated Equity
$233,339
Purchase Details
Closed on
Jun 13, 2007
Sold by
Felner Richard and Felner Linda
Bought by
Felner Brian
Purchase Details
Closed on
Sep 2, 2004
Sold by
Velez Santiago and Velez Marc M
Bought by
Hildago Maria
Purchase Details
Closed on
Jan 22, 2001
Sold by
Petrie Patrick and Petrie Anthony
Bought by
Velez Marcia and Velz Santiago N
Purchase Details
Closed on
Nov 18, 1996
Sold by
New Rivers Edge Dev
Bought by
Petrie Patrick and Petrie Anthony F
Create a Home Valuation Report for This Property
The Home Valuation Report is an in-depth analysis detailing your home's value as well as a comparison with similar homes in the area
Home Values in the Area
Average Home Value in this Area
Purchase History
| Date | Buyer | Sale Price | Title Company |
|---|---|---|---|
| Colligan Jessica | $214,000 | -- | |
| Colligan Jessica | $214,000 | -- | |
| Felner Brian | $220,000 | -- | |
| Felner Brian | $220,000 | -- | |
| Hildago Maria | $145,000 | -- | |
| Hildago Maria | $145,000 | -- | |
| Velez Marcia | $133,000 | -- | |
| Velez Marcia | $133,000 | -- | |
| Petrie Patrick | $99,000 | -- | |
| Petrie Patrick | $99,000 | -- |
Source: Public Records
Mortgage History
| Date | Status | Borrower | Loan Amount |
|---|---|---|---|
| Open | Petrie Patrick | $115,500 | |
| Closed | Petrie Patrick | $115,500 |
Source: Public Records
Tax History
| Year | Tax Paid | Tax Assessment Tax Assessment Total Assessment is a certain percentage of the fair market value that is determined by local assessors to be the total taxable value of land and additions on the property. | Land | Improvement |
|---|---|---|---|---|
| 2025 | $4,534 | $104,340 | $0 | $104,340 |
| 2024 | $4,534 | $104,340 | $0 | $104,340 |
| 2023 | $4,534 | $104,340 | $0 | $104,340 |
| 2022 | $4,534 | $104,340 | $0 | $104,340 |
| 2021 | $4,534 | $104,340 | $0 | $104,340 |
| 2020 | $5,422 | $100,420 | $0 | $100,420 |
| 2019 | $5,422 | $100,420 | $0 | $100,420 |
| 2018 | $5,460 | $100,420 | $0 | $100,420 |
| 2017 | $5,460 | $100,420 | $0 | $100,420 |
| 2016 | $5,460 | $100,420 | $0 | $100,420 |
| 2015 | $5,932 | $140,570 | $0 | $140,570 |
| 2014 | $5,932 | $140,570 | $0 | $140,570 |
Source: Public Records
Map
Nearby Homes
- 25 Cartright St Unit 3K
- 25 Cartright St Unit 5D
- 80 Cartright St Unit 5D
- 80 Cartright St Unit 2F
- 80 Cartright St Unit 8B
- 80 Cartright St Unit PHA
- 2660 North Ave Unit 238
- 74 Carleton Ave
- 2370 North Ave Unit 3F
- 860 Briarwood Ave
- 64 Moody Ave
- 155 Moody Ave
- 301 Poplar St Unit 303
- 155 Brooklawn Ave
- 412 Dewey St
- 246 Lenox Ave
- 1050 Hancock Ave Unit 1052
- 203 Lenox Ave Unit 205
- 195 Lenox Ave Unit 197
- 137 Poplar St
- 2612 North Ave Unit E20
- 2612 North Ave Unit E18
- 2612 North Ave Unit E14
- 2612 North Ave Unit E12
- 2612 North Ave Unit E10
- 2612 North Ave Unit E9
- 2612 North Ave Unit E8
- 2612 North Ave Unit E7
- 2612 North Ave Unit E6
- 2612 North Ave Unit E5
- 2612 North Ave Unit E4
- 2612 North Ave Unit E3
- 2612 North Ave Unit E1
- 2612 North Ave Unit C8
- 2612 North Ave Unit C7
- 2612 North Ave Unit C6
- 2612 North Ave Unit C5
- 2612 North Ave Unit C4
- 2612 North Ave Unit C3
- 2612 North Ave Unit C2
Your Personal Tour Guide
Ask me questions while you tour the home.