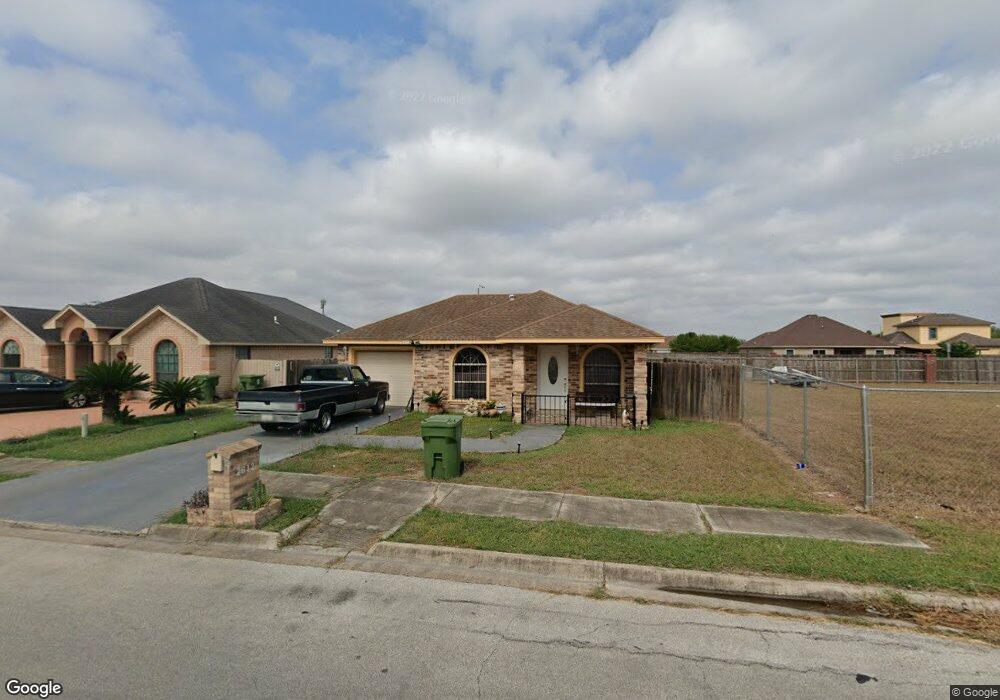
2612 Venice Brownsville, TX 78520
Estimated Value: $146,071 - $179,000
--
Bed
--
Bath
925
Sq Ft
$179/Sq Ft
Est. Value
About This Home
This home is located at 2612 Venice, Brownsville, TX 78520 and is currently estimated at $165,268, approximately $178 per square foot. 2612 Venice is a home located in Cameron County with nearby schools including Thomas W. Keller Elementary School, Edward Manzano Jr. Middle School, and Pace Early College High School.
Ownership History
Date
Name
Owned For
Owner Type
Purchase Details
Closed on
Nov 19, 2004
Sold by
Rangel Francisco E and Rangel Maria I
Bought by
Garcia Enrique
Current Estimated Value
Home Financials for this Owner
Home Financials are based on the most recent Mortgage that was taken out on this home.
Original Mortgage
$68,150
Outstanding Balance
$33,873
Interest Rate
5.72%
Mortgage Type
VA
Estimated Equity
$131,395
Purchase Details
Closed on
Jun 4, 2003
Sold by
Delacueva Leslie Ann
Bought by
Rangel Francisco E and Rangel Maria I
Purchase Details
Closed on
Aug 27, 2002
Sold by
Delacueva Maria
Bought by
Delacueva Leslie Ann
Purchase Details
Closed on
Mar 2, 2002
Sold by
El Valle Properties Ltd
Bought by
Delacueva Maria
Home Financials for this Owner
Home Financials are based on the most recent Mortgage that was taken out on this home.
Original Mortgage
$14,000
Interest Rate
12%
Mortgage Type
Seller Take Back
Create a Home Valuation Report for This Property
The Home Valuation Report is an in-depth analysis detailing your home's value as well as a comparison with similar homes in the area
Home Values in the Area
Average Home Value in this Area
Purchase History
| Date | Buyer | Sale Price | Title Company |
|---|---|---|---|
| Garcia Enrique | -- | Southern Texas Title Co | |
| Rangel Francisco E | -- | -- | |
| Delacueva Leslie Ann | -- | -- | |
| Delacueva Maria | -- | -- |
Source: Public Records
Mortgage History
| Date | Status | Borrower | Loan Amount |
|---|---|---|---|
| Open | Garcia Enrique | $68,150 | |
| Previous Owner | Delacueva Maria | $14,000 | |
| Closed | Delacueva Leslie Ann | $0 |
Source: Public Records
Tax History Compared to Growth
Tax History
| Year | Tax Paid | Tax Assessment Tax Assessment Total Assessment is a certain percentage of the fair market value that is determined by local assessors to be the total taxable value of land and additions on the property. | Land | Improvement |
|---|---|---|---|---|
| 2025 | -- | $140,127 | -- | -- |
| 2024 | $1,348 | $127,388 | -- | -- |
| 2023 | $2,657 | $115,807 | $0 | $0 |
| 2022 | $2,731 | $105,279 | $0 | $0 |
| 2021 | $2,474 | $116,530 | $24,000 | $92,530 |
| 2020 | $2,410 | $92,537 | $24,000 | $68,537 |
| 2019 | $2,297 | $92,537 | $24,000 | $68,537 |
| 2018 | $2,005 | $75,477 | $21,000 | $54,477 |
| 2017 | $1,928 | $76,079 | $21,000 | $55,079 |
| 2016 | $1,855 | $73,181 | $17,500 | $55,681 |
| 2015 | $1,356 | $73,282 | $17,000 | $56,282 |
Source: Public Records
Map
Nearby Homes
- 0 W Alton Gloor Blvd
- 2720 Mayorca St
- 2848 Riviera St
- 1920 Royal Oak St
- 2822 W Alton Gloor Blvd
- 2782 Normandy St
- 1809 Royal Oak St
- 1974 Royal Oak St
- 1708 Deep Spring St
- 2650 Paris St
- 2614 Paris St
- 2734 Paris St
- 3516 Hidalgo Cir Unit LOT 1 BLK 4
- 3604 Hidalgo Cir Unit LOT 1 BLK 6
- 3770 Altamira
- 2400 Firenze St
- 00 Laredo Rd
- TBD Beach Dunes Lot 21
- 4025 Sevilla St
- 3949 Galicia Ct Unit 17
- 2616 Venice
- 2620 Venice
- 2600 Venice
- 2643 Normandy St
- 2624 Venice
- 2780 Capri St
- 2647 Normandy St
- 2628 Venice
- 2764 Gibralter St
- 2760 Gibralter St
- 2641 Naples St
- 2772 Gibraltar St
- 2756 Gibralter St
- 2784 Capri St
- 2651 Normandy St
- 2650 Normandy St
- 2632 Venice
- 2752 Gibralter St
- 2645 Naples St
- 2788 Capri St