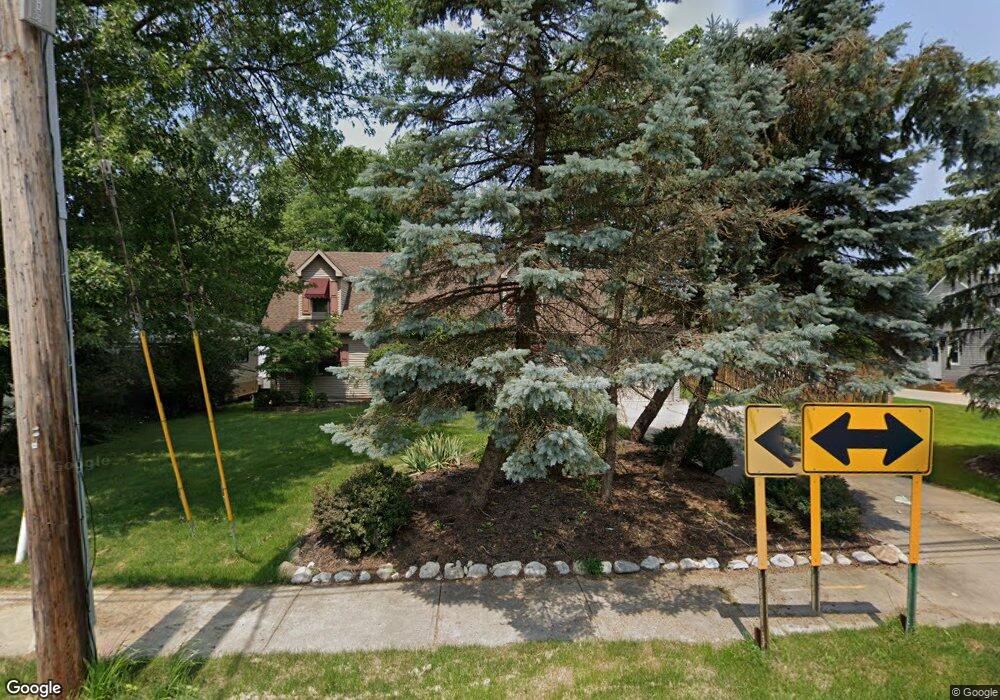
26120 Cook Rd Olmsted Falls, OH 44138
Estimated Value: $306,000 - $404,000
3
Beds
3
Baths
2,142
Sq Ft
$165/Sq Ft
Est. Value
About This Home
This home is located at 26120 Cook Rd, Olmsted Falls, OH 44138 and is currently estimated at $353,991, approximately $165 per square foot. 26120 Cook Rd is a home located in Cuyahoga County with nearby schools including Falls-Lenox Primary Elementary School, Olmsted Falls Intermediate Building, and Olmsted Falls Middle School.
Ownership History
Date
Name
Owned For
Owner Type
Purchase Details
Closed on
Oct 16, 2003
Sold by
Zeck Richard S and Zeck Diane H
Bought by
Glendenning Dennis R and Glendenning Melissa J
Current Estimated Value
Home Financials for this Owner
Home Financials are based on the most recent Mortgage that was taken out on this home.
Original Mortgage
$158,600
Interest Rate
6.49%
Mortgage Type
Purchase Money Mortgage
Purchase Details
Closed on
Oct 14, 1999
Sold by
Trailer Mart Inc
Bought by
Zeck Richard S and Zeck Diane H
Home Financials for this Owner
Home Financials are based on the most recent Mortgage that was taken out on this home.
Original Mortgage
$127,000
Interest Rate
7.91%
Mortgage Type
Purchase Money Mortgage
Create a Home Valuation Report for This Property
The Home Valuation Report is an in-depth analysis detailing your home's value as well as a comparison with similar homes in the area
Home Values in the Area
Average Home Value in this Area
Purchase History
| Date | Buyer | Sale Price | Title Company |
|---|---|---|---|
| Glendenning Dennis R | $186,700 | Title Access Llc | |
| Zeck Richard S | $159,000 | Midland Title Security Inc |
Source: Public Records
Mortgage History
| Date | Status | Borrower | Loan Amount |
|---|---|---|---|
| Closed | Glendenning Dennis R | $158,600 | |
| Closed | Zeck Richard S | $127,000 |
Source: Public Records
Tax History Compared to Growth
Tax History
| Year | Tax Paid | Tax Assessment Tax Assessment Total Assessment is a certain percentage of the fair market value that is determined by local assessors to be the total taxable value of land and additions on the property. | Land | Improvement |
|---|---|---|---|---|
| 2024 | $8,438 | $114,415 | $4,585 | $109,830 |
| 2023 | $7,588 | $83,480 | $3,540 | $79,940 |
| 2022 | $7,535 | $83,480 | $3,540 | $79,940 |
| 2021 | $7,242 | $83,480 | $3,540 | $79,940 |
| 2020 | $6,862 | $70,140 | $2,980 | $67,170 |
| 2019 | $6,193 | $200,400 | $8,500 | $191,900 |
| 2018 | $5,907 | $70,140 | $2,980 | $67,170 |
| 2017 | $5,454 | $58,280 | $2,450 | $55,830 |
| 2016 | $5,428 | $58,280 | $2,450 | $55,830 |
| 2015 | $5,530 | $58,280 | $2,450 | $55,830 |
| 2014 | $5,530 | $58,280 | $2,450 | $55,830 |
Source: Public Records
Map
Nearby Homes
- 25725 Cook Rd
- 27 Sycamore Dr
- 5 Hawthorn Dr
- 3 Dogwood Ln
- 11 Concert Ct
- 7593 Columbia Rd
- 3 Concert Ln
- 11 Brookins Dr
- V/L Columbia Rd
- 55 Patio Ln
- 42 Periwinkle Dr
- 52 Periwinkle Dr
- 16 Van Ess Dr
- 3 Fiddle Sticks
- 26685 Cranage Rd
- 7030 Columbia Rd
- 281-12-024 River Rd
- 20 Van Ess Dr
- 281-12-007 River Rd
- 25950 Bagley Rd