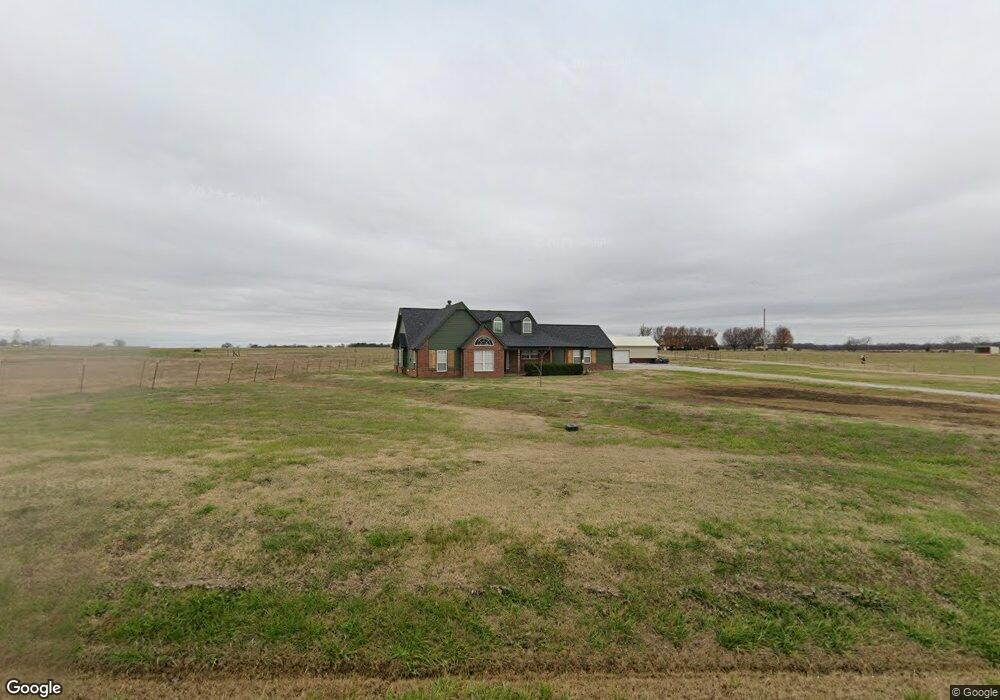
26122 E 201st St S Haskell, OK 74436
Estimated Value: $351,000 - $437,000
3
Beds
2
Baths
1,872
Sq Ft
$207/Sq Ft
Est. Value
About This Home
This home is located at 26122 E 201st St S, Haskell, OK 74436 and is currently estimated at $388,152, approximately $207 per square foot. 26122 E 201st St S is a home located in Wagoner County with nearby schools including Donald P. Sloat Junior High School, Coweta High School, and Coweta Intermediate High School.
Ownership History
Date
Name
Owned For
Owner Type
Purchase Details
Closed on
Jun 20, 2008
Sold by
Hunter William H
Bought by
Harrison Jason Warner and Harrison Kimberlea Michelle
Current Estimated Value
Home Financials for this Owner
Home Financials are based on the most recent Mortgage that was taken out on this home.
Original Mortgage
$180,800
Outstanding Balance
$115,514
Interest Rate
6.05%
Mortgage Type
New Conventional
Estimated Equity
$272,638
Purchase Details
Closed on
Mar 24, 2006
Sold by
American Escrow & Closing Co
Bought by
Hunter William H and Hunter Gladys M
Purchase Details
Closed on
Sep 20, 2005
Sold by
Hargrove Jimmy L
Bought by
Hart Donald W and Hart Karen
Home Financials for this Owner
Home Financials are based on the most recent Mortgage that was taken out on this home.
Original Mortgage
$23,900
Interest Rate
5.73%
Mortgage Type
Credit Line Revolving
Create a Home Valuation Report for This Property
The Home Valuation Report is an in-depth analysis detailing your home's value as well as a comparison with similar homes in the area
Purchase History
| Date | Buyer | Sale Price | Title Company |
|---|---|---|---|
| Harrison Jason Warner | $226,000 | Multiple | |
| Hunter William H | $170,000 | Firstitle & Abstract Service | |
| Hart Donald W | $169,500 | Guaranty Abstract Company |
Source: Public Records
Mortgage History
| Date | Status | Borrower | Loan Amount |
|---|---|---|---|
| Open | Harrison Jason Warner | $180,800 | |
| Previous Owner | Hart Donald W | $23,900 |
Source: Public Records
Tax History
| Year | Tax Paid | Tax Assessment Tax Assessment Total Assessment is a certain percentage of the fair market value that is determined by local assessors to be the total taxable value of land and additions on the property. | Land | Improvement |
|---|---|---|---|---|
| 2025 | $2,198 | $24,173 | $3,676 | $20,497 |
| 2024 | $2,126 | $23,468 | $3,569 | $19,899 |
| 2023 | $2,061 | $22,784 | $3,451 | $19,333 |
| 2022 | $2,135 | $22,122 | $3,313 | $18,809 |
| 2021 | $2,110 | $21,477 | $3,122 | $18,355 |
| 2020 | $1,991 | $20,851 | $2,903 | $17,948 |
| 2019 | $1,965 | $20,245 | $2,633 | $17,612 |
| 2018 | $1,957 | $19,806 | $2,194 | $17,612 |
| 2017 | $1,977 | $20,341 | $2,194 | $18,147 |
| 2016 | $1,930 | $19,824 | $2,819 | $17,005 |
| 2015 | $1,950 | $19,247 | $2,194 | $17,053 |
| 2014 | $2,472 | $24,326 | $3,920 | $20,406 |
Source: Public Records
Map
Nearby Homes
- 21301 E 201st St S
- 27000 E 201st St S
- 25888 E 191st St S
- 19923 W 80th St N
- 20172 US Highway 64
- 0 S 221st East Ave
- 19300 U S Highway 64
- 1188 N Amelia Ln
- 1185 N Amelia Ln
- 0 W Duncan Road Haskell Ok Rd
- 1157 N Amelia Ln
- 1132 N Amelia Ln
- 1129 N Amelia Ln
- 1104 N Amelia Ln
- 1101 N Amelia Ln
- 1073 N Amelia Ln
- 1160 N Amelia Ln
- 913 N Creek Ave
- 820 N Broadway
- 113 E Pine St
- 26212 E 201st St S
- 26105 E 201st St S
- 26244 E 201st St S
- 26338 E 201st St S
- 7455 N 214th St W
- 26464 E 201st St S
- 26321 E 201st St S
- 25796 E 201st St S
- 26640 E 201st St S
- 25708 E 201st St S
- 02 E 201st St S
- 2 E 201st St S
- 40 E 201st St S
- 0004 E 201st St S
- 0005 E 201st St S
- 0003 E 201st St S
- 0001 E 201st St S
- 0002 E 201st St S
- 26738 E 201st St S
- 25797 E 201st St S
Your Personal Tour Guide
Ask me questions while you tour the home.