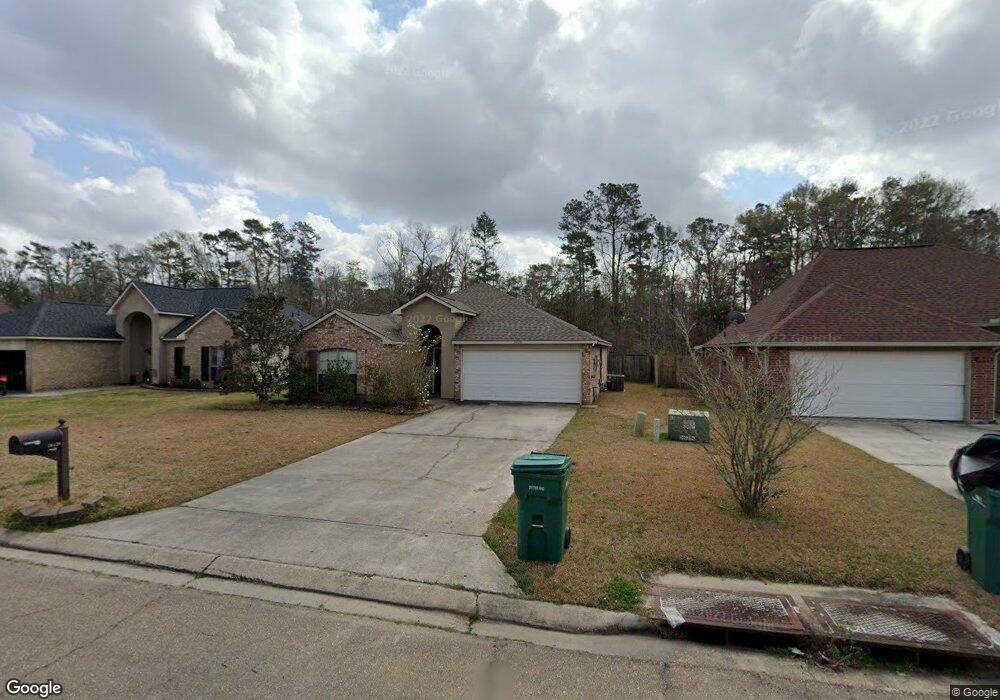
26126 Glenbrook Dr Denham Springs, LA 70726
Estimated Value: $228,740 - $242,000
--
Bed
2
Baths
--
Sq Ft
8,625
Sq Ft Lot
About This Home
This home is located at 26126 Glenbrook Dr, Denham Springs, LA 70726 and is currently estimated at $234,935. 26126 Glenbrook Dr is a home located in Livingston Parish with nearby schools including South Walker Elementary School, Westside Junior High School, and Walker High School.
Ownership History
Date
Name
Owned For
Owner Type
Purchase Details
Closed on
Dec 30, 2020
Sold by
Anderson Cameron T
Bought by
Vessell Teara J
Current Estimated Value
Purchase Details
Closed on
Jun 24, 2011
Sold by
Bergerson Dykes Kristin and Mikel Hugh Dykes J
Bought by
Woolie Lance Brandon and Niera Carmen Constanza
Home Financials for this Owner
Home Financials are based on the most recent Mortgage that was taken out on this home.
Original Mortgage
$151,813
Interest Rate
4.65%
Mortgage Type
New Conventional
Purchase Details
Closed on
Feb 29, 2008
Sold by
Soileau Donald
Bought by
Dykes Jmikel H and Bergeron Kristin Elaine
Home Financials for this Owner
Home Financials are based on the most recent Mortgage that was taken out on this home.
Original Mortgage
$132,750
Interest Rate
5.72%
Mortgage Type
New Conventional
Purchase Details
Closed on
Dec 27, 2006
Sold by
D R Horton Inc Gulf Coast
Bought by
Soileau Donald L and Soileau Family Trust
Create a Home Valuation Report for This Property
The Home Valuation Report is an in-depth analysis detailing your home's value as well as a comparison with similar homes in the area
Home Values in the Area
Average Home Value in this Area
Purchase History
| Date | Buyer | Sale Price | Title Company |
|---|---|---|---|
| Vessell Teara J | $215,000 | None Available | |
| Woolie Lance Brandon | $146,500 | Alliance Title Co Llc | |
| Dykes Jmikel H | $147,500 | Clean Title Llc | |
| Soileau Donald L | $148,200 | Milestone Title Inc |
Source: Public Records
Mortgage History
| Date | Status | Borrower | Loan Amount |
|---|---|---|---|
| Previous Owner | Woolie Lance Brandon | $151,813 | |
| Previous Owner | Dykes Jmikel H | $132,750 |
Source: Public Records
Tax History Compared to Growth
Tax History
| Year | Tax Paid | Tax Assessment Tax Assessment Total Assessment is a certain percentage of the fair market value that is determined by local assessors to be the total taxable value of land and additions on the property. | Land | Improvement |
|---|---|---|---|---|
| 2024 | $2,112 | $20,118 | $2,900 | $17,218 |
| 2023 | $1,817 | $14,920 | $2,900 | $12,020 |
| 2022 | $1,829 | $14,920 | $2,900 | $12,020 |
| 2021 | $1,611 | $14,920 | $2,900 | $12,020 |
| 2020 | $1,603 | $14,920 | $2,900 | $12,020 |
| 2019 | $1,471 | $13,300 | $2,900 | $10,400 |
| 2018 | $1,484 | $13,300 | $2,900 | $10,400 |
| 2017 | $1,459 | $12,780 | $2,900 | $9,880 |
| 2015 | $816 | $14,360 | $2,900 | $11,460 |
| 2014 | $1,701 | $14,360 | $2,900 | $11,460 |
Source: Public Records
Map
Nearby Homes
- 26101 Glenbrooke Dr
- 26158 Glenbrooke Dr
- 12943 Hazlewood Dr
- 12738 Bonnie Bleu Dr
- 12789 Bonnie Bleu Dr
- 12819 Bonnie Bleu Dr
- 26414 Maplewood Dr
- 26407 Millstone Dr
- 26559 Parkwood Dr
- 13460 Wynnewood Ave
- 30045 Sanctuary Blvd
- 30168 Sanctuary Blvd
- 12495 Buddy Ellis Rd
- 25914 Bronzewood St
- 26579 Old Barnwood Ave
- 26100 Walker Rd S
- Edison Plan at Indigo Trails
- Cameron Plan at Indigo Trails
- Cullen Plan at Indigo Trails
- 25672 Buffwood St
- 26126 Glenbrooke Dr
- 26120 Glenbrooke Dr
- 26132 Glenbrooke Dr
- 26138 Glenbrooke Dr
- 26110 Glenbrooke Dr
- 26131 Glenbrooke Dr
- 26131 Glenbrooke Dr
- 26102 Glenbrooke Dr
- 26125 Glenbrooke Dr
- 26137 Glenbrooke Dr
- 26158 Poplar Glen Dr
- 26119 Glenbrooke Dr
- 26096 Glenbrooke Dr
- 26164 Poplar Glen Dr
- 26113 Glenbrooke Dr
- 26149 Glenbrooke Dr
- 26107 Glenbrooke Dr
- 26088 Glenbrooke Dr
- 26170 Poplar Glen Dr
- 26161 Glenbrooke Dr