Estimated Value: $410,505 - $476,000
3
Beds
2
Baths
2,090
Sq Ft
$212/Sq Ft
Est. Value
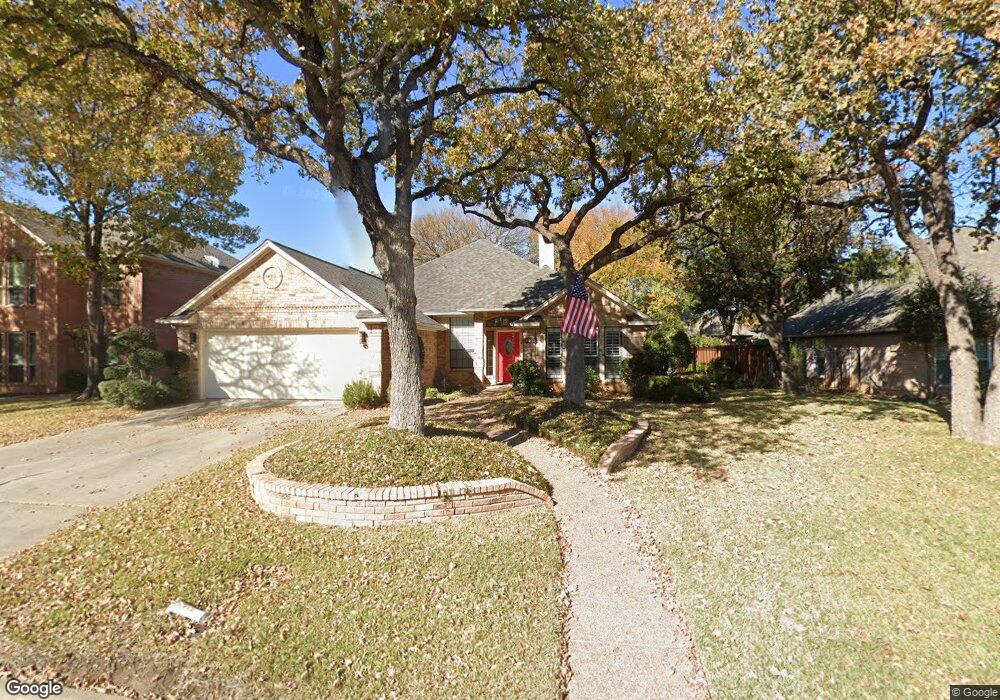
About This Home
This home is located at 2613 Bent Tree Dr, Hurst, TX 76054 and is currently estimated at $443,876, approximately $212 per square foot. 2613 Bent Tree Dr is a home located in Tarrant County with nearby schools including Walker Creek Elementary School, Smithfield Middle School, and Birdville High School.
Ownership History
Date
Name
Owned For
Owner Type
Purchase Details
Closed on
Feb 6, 2025
Sold by
Mcelroy Donna Raynae
Bought by
Mcelroy Donna Raynae and Biggs Kendall Renee
Current Estimated Value
Purchase Details
Closed on
Mar 1, 2015
Sold by
Maricle Carolyn
Bought by
Mcelroy Donna
Purchase Details
Closed on
Oct 18, 2011
Sold by
Thornton Gloria and Thornton Gloria T
Bought by
Maricle Carolyn
Purchase Details
Closed on
Dec 21, 2010
Sold by
Thornton Gloria
Bought by
Thornton Gloria
Purchase Details
Closed on
Nov 1, 1999
Sold by
Thornton Gloria T
Bought by
Gloria Thornton Trust
Purchase Details
Closed on
Feb 8, 1999
Sold by
Thornton Gloria Joyce Teasley
Bought by
Thornton Gloria T
Purchase Details
Closed on
Dec 29, 1993
Sold by
Margaret Development Ltd
Bought by
Thornton Jack E and Thornton Gloria T
Create a Home Valuation Report for This Property
The Home Valuation Report is an in-depth analysis detailing your home's value as well as a comparison with similar homes in the area
Home Values in the Area
Average Home Value in this Area
Purchase History
| Date | Buyer | Sale Price | Title Company |
|---|---|---|---|
| Mcelroy Donna Raynae | -- | Capital Title Of Texas | |
| Mcelroy Donna | -- | None Available | |
| Maricle Carolyn | -- | None Available | |
| Thornton Gloria | -- | None Available | |
| Gloria Thornton Trust | -- | -- | |
| Thornton Gloria T | -- | -- | |
| Thornton Jack E | -- | -- |
Source: Public Records
Tax History Compared to Growth
Tax History
| Year | Tax Paid | Tax Assessment Tax Assessment Total Assessment is a certain percentage of the fair market value that is determined by local assessors to be the total taxable value of land and additions on the property. | Land | Improvement |
|---|---|---|---|---|
| 2025 | $3,277 | $349,000 | $65,000 | $284,000 |
| 2024 | $3,277 | $371,000 | $65,000 | $306,000 |
| 2023 | $6,775 | $325,000 | $65,000 | $260,000 |
| 2022 | $6,663 | $291,000 | $45,000 | $246,000 |
| 2021 | $6,355 | $245,000 | $45,000 | $200,000 |
| 2020 | $6,296 | $245,000 | $45,000 | $200,000 |
| 2019 | $6,440 | $245,000 | $45,000 | $200,000 |
| 2018 | $5,233 | $238,596 | $45,000 | $193,596 |
| 2017 | $6,392 | $239,542 | $45,000 | $194,542 |
| 2016 | $6,201 | $232,397 | $40,000 | $192,397 |
| 2015 | $3,735 | $197,100 | $25,000 | $172,100 |
| 2014 | $3,735 | $197,100 | $25,000 | $172,100 |
Source: Public Records
Map
Nearby Homes
- 2668 Bent Tree Dr
- 712 Springwood Dr
- 2244 Hurstview Dr
- 2212 Hurstview Dr
- 6521 Rock Springs Dr
- 736 Springhill Dr
- 712 Springhill Dr
- 404 Heather Ln
- 2804 Ridgewood Dr
- 2620 Brookridge Dr
- 6505 Parkway Ave
- 8920 Martin Dr
- 2908 Steve Dr
- 2732 Woodbridge Dr
- 3713 Brentwood Ct
- 2809 Sandstone Dr
- 6801 Woodland Hills Dr
- 2844 Hurstview Dr
- 8886 Ice House Dr
- 6704 Nob Hill Ct
- 2617 Bent Tree Dr
- 2609 Bent Tree Dr
- 2604 Briargrove Dr
- 2608 Briargrove Dr
- 2621 Bent Tree Dr
- 2605 Bent Tree Dr
- 2612 Briargrove Dr
- 2616 Bent Tree Dr
- 2612 Bent Tree Dr
- 2600 Briargrove Dr
- 2620 Bent Tree Dr
- 2616 Briargrove Dr
- 2625 Bent Tree Dr
- 2608 Bent Tree Dr
- 2601 Bent Tree Dr
- 2624 Bent Tree Dr
- 2604 Bent Tree Dr
- 2601 Briargrove Dr
- 2620 Briargrove Dr
- 2605 Briargrove Dr