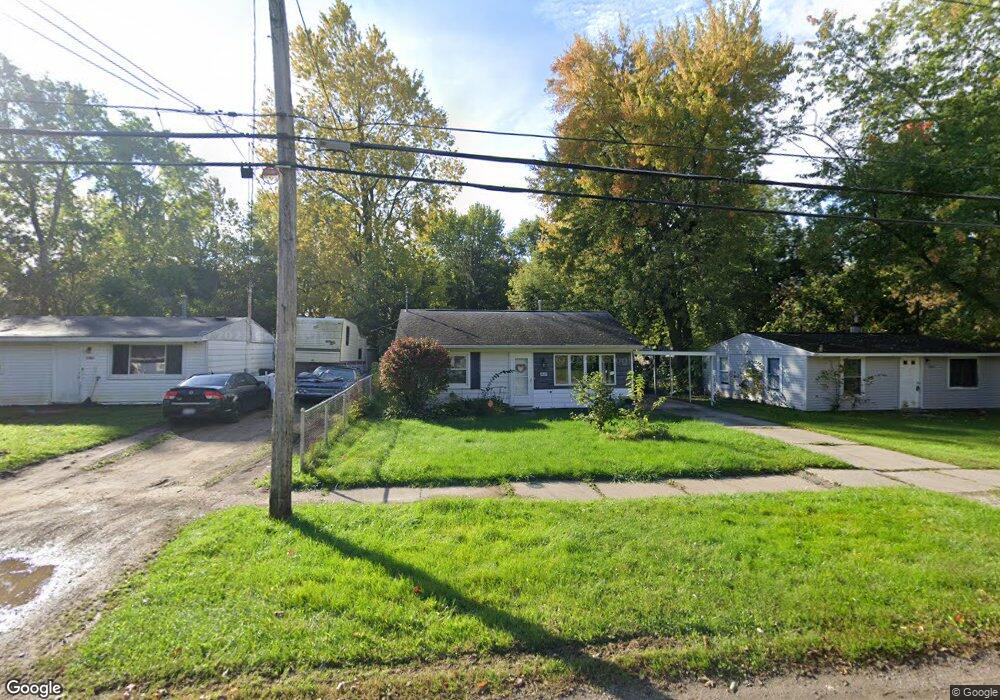
2613 Greenbelt Dr Lansing, MI 48911
Pleasant Grove NeighborhoodEstimated Value: $57,000 - $85,000
2
Beds
1
Bath
689
Sq Ft
$106/Sq Ft
Est. Value
About This Home
This home is located at 2613 Greenbelt Dr, Lansing, MI 48911 and is currently estimated at $73,033, approximately $105 per square foot. 2613 Greenbelt Dr is a home located in Ingham County with nearby schools including Reo Elementary School, Attwood School, and Everett High School.
Ownership History
Date
Name
Owned For
Owner Type
Purchase Details
Closed on
Apr 2, 2024
Sold by
Tillguard Llc
Bought by
Mores Rigorbert
Current Estimated Value
Purchase Details
Closed on
Jul 15, 2019
Sold by
Complete Housing Solution Llc
Bought by
Tillguard Llc
Purchase Details
Closed on
Dec 10, 2012
Sold by
Lambert George H and Lambert Teresa A
Bought by
Complete Housing Solution Llc
Purchase Details
Closed on
Aug 4, 2012
Sold by
Huber Dale D and Huber Sara E
Bought by
Complete Housing Solution Llc
Home Financials for this Owner
Home Financials are based on the most recent Mortgage that was taken out on this home.
Original Mortgage
$19,762
Interest Rate
3.46%
Mortgage Type
New Conventional
Purchase Details
Closed on
Jun 23, 2012
Sold by
Eymann Susan K
Bought by
Lambert George and Lambert Teresa Ann
Home Financials for this Owner
Home Financials are based on the most recent Mortgage that was taken out on this home.
Original Mortgage
$19,762
Interest Rate
3.46%
Mortgage Type
New Conventional
Create a Home Valuation Report for This Property
The Home Valuation Report is an in-depth analysis detailing your home's value as well as a comparison with similar homes in the area
Home Values in the Area
Average Home Value in this Area
Purchase History
| Date | Buyer | Sale Price | Title Company |
|---|---|---|---|
| Mores Rigorbert | $47,000 | None Listed On Document | |
| Tillguard Llc | -- | None Available | |
| Complete Housing Solution Llc | -- | None Available | |
| Complete Housing Solution Llc | -- | None Available | |
| Lambert George | -- | None Available |
Source: Public Records
Mortgage History
| Date | Status | Borrower | Loan Amount |
|---|---|---|---|
| Previous Owner | Complete Housing Solution Llc | $19,762 |
Source: Public Records
Tax History Compared to Growth
Tax History
| Year | Tax Paid | Tax Assessment Tax Assessment Total Assessment is a certain percentage of the fair market value that is determined by local assessors to be the total taxable value of land and additions on the property. | Land | Improvement |
|---|---|---|---|---|
| 2025 | $2,703 | $25,200 | $7,000 | $18,200 |
| 2024 | $24 | $22,400 | $7,000 | $15,400 |
| 2023 | $1,190 | $20,100 | $7,000 | $13,100 |
| 2022 | $1,091 | $18,800 | $7,800 | $11,000 |
| 2021 | $1,067 | $15,600 | $3,900 | $11,700 |
| 2020 | $1,058 | $13,900 | $3,900 | $10,000 |
| 2019 | $1,019 | $13,300 | $3,900 | $9,400 |
| 2018 | $1,741 | $11,800 | $3,900 | $7,900 |
| 2017 | $932 | $11,800 | $3,900 | $7,900 |
| 2016 | $751 | $11,600 | $3,900 | $7,700 |
| 2015 | $751 | $11,300 | $7,795 | $3,505 |
| 2014 | $751 | $12,200 | $11,692 | $508 |
Source: Public Records
Map
Nearby Homes
- 2816 Greenbelt Dr
- 2311 Greenbelt Dr
- 4110 Richmond St
- 4017 Richmond St
- 3006 Hillcrest St
- 3115 Risdale Ave
- 4628 Pleasant Grove Rd
- 2029 Hillcrest St
- 3100 Glenbrook Dr
- 4809 Ballard Rd
- 3424 S Catherine St
- 4828 Ingham St
- 4000 Churchill Ave
- 3336 Avalon St
- 3330 Avalon St
- 3334 Ingham St
- 3324 Viking St
- 4620 Christiansen Rd
- 3312 Pleasant Grove Rd
- 0 S Deerfield Ave
- 2607 Greenbelt Dr
- 4111 Ingham St
- 4105 Ingham St
- 2603 Greenbelt Dr
- 4119 Ingham St
- 2517 Greenbelt Dr
- 2612 Fielding Dr
- 2608 Fielding Dr
- 2513 Greenbelt Dr
- 4125 Ingham St
- 2606 Greenbelt Dr
- 4110 Ingham St
- 2516 Fielding Dr
- 4116 Ingham St
- 2600 Greenbelt Dr
- 4009 Ingham St
- 4020 Ingham St
- 2507 Greenbelt Dr
- 2512 Fielding Dr
- 4120 Ingham St