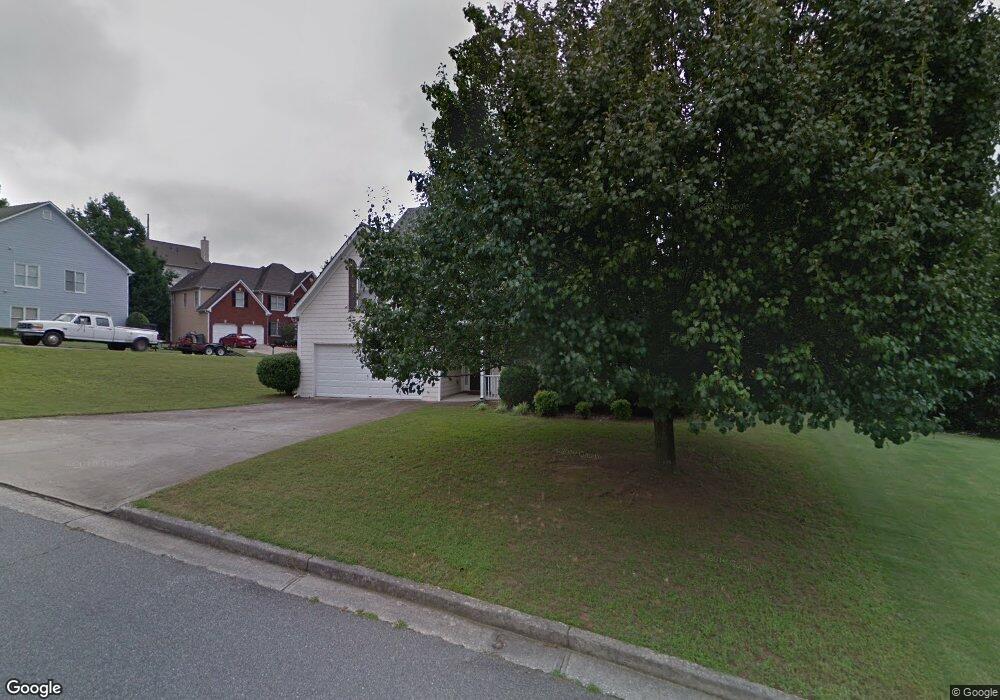
2613 Jacobean Rd Unit 2 Acworth, GA 30101
Estimated Value: $371,000 - $420,000
4
Beds
3
Baths
2,210
Sq Ft
$178/Sq Ft
Est. Value
About This Home
This home is located at 2613 Jacobean Rd Unit 2, Acworth, GA 30101 and is currently estimated at $393,255, approximately $177 per square foot. 2613 Jacobean Rd Unit 2 is a home located in Cobb County with nearby schools including Baker Elementary School, Barber Middle School, and North Cobb High School.
Ownership History
Date
Name
Owned For
Owner Type
Purchase Details
Closed on
Aug 11, 2021
Sold by
Star Capital Investment Group Llc
Bought by
Sfr Xii Atl Owner 3 Lp
Current Estimated Value
Purchase Details
Closed on
Jun 15, 2006
Sold by
Logsdon Thomas T
Bought by
Horowitz Louis R and Horowitz Linda F
Home Financials for this Owner
Home Financials are based on the most recent Mortgage that was taken out on this home.
Original Mortgage
$158,000
Interest Rate
6.49%
Mortgage Type
New Conventional
Purchase Details
Closed on
May 30, 2000
Sold by
Brownstone Associates Inc
Bought by
Formaro Charles R
Home Financials for this Owner
Home Financials are based on the most recent Mortgage that was taken out on this home.
Original Mortgage
$157,500
Interest Rate
8.11%
Mortgage Type
New Conventional
Create a Home Valuation Report for This Property
The Home Valuation Report is an in-depth analysis detailing your home's value as well as a comparison with similar homes in the area
Home Values in the Area
Average Home Value in this Area
Purchase History
| Date | Buyer | Sale Price | Title Company |
|---|---|---|---|
| Sfr Xii Atl Owner 3 Lp | $335,100 | None Available | |
| Star Capital Investment Group Llc | $305,000 | None Available | |
| Horowitz Louis R | $198,600 | -- | |
| Formaro Charles R | $175,000 | -- |
Source: Public Records
Mortgage History
| Date | Status | Borrower | Loan Amount |
|---|---|---|---|
| Previous Owner | Horowitz Louis R | $158,000 | |
| Previous Owner | Formaro Charles R | $157,500 |
Source: Public Records
Tax History Compared to Growth
Tax History
| Year | Tax Paid | Tax Assessment Tax Assessment Total Assessment is a certain percentage of the fair market value that is determined by local assessors to be the total taxable value of land and additions on the property. | Land | Improvement |
|---|---|---|---|---|
| 2025 | $4,241 | $140,748 | $22,000 | $118,748 |
| 2024 | $4,244 | $140,748 | $22,000 | $118,748 |
| 2023 | $4,244 | $140,748 | $22,000 | $118,748 |
| 2022 | $3,979 | $131,092 | $22,000 | $109,092 |
| 2021 | $3,189 | $105,088 | $22,000 | $83,088 |
| 2020 | $4,011 | $100,648 | $26,000 | $74,648 |
| 2019 | $2,596 | $85,520 | $26,000 | $59,520 |
| 2018 | $2,312 | $76,168 | $19,200 | $56,968 |
| 2017 | $2,190 | $76,168 | $19,200 | $56,968 |
| 2016 | $2,190 | $76,168 | $19,200 | $56,968 |
| 2015 | $1,656 | $56,212 | $19,200 | $37,012 |
| 2014 | $1,670 | $56,212 | $0 | $0 |
Source: Public Records
Map
Nearby Homes
- 4321 Clairesbrook Ln
- 4344 Thorngate Ln
- 4336 Thorngate Ln
- 4210 Steeplehill Dr NW
- 4198 Gramercy Main NW
- 4476 High Gate Ct NW
- 2698 Claredon Trace NW
- 2773 Northgate Way NW Unit 1
- 2540 Willow Grove Rd NW Unit 15
- 4317 Chesapeake Trace NW
- 2264 Serenity Dr NW
- 2482 Insdale Trace NW
- 4591 Grenadine Cir
- 4662 Webster Way NW
- 2521 Eden Ridge Ln Unit 7
- 2170 Sugar Maple Cove NW
- 2430 Brookgreen Commons NW
- 2613 Jacobean Rd
- 2613 Jacobean Rd
- 0 Morlowe Ct Unit 7067620
- 0 Morlowe Ct Unit 8185984
- 4348 Clairesbrook Ln
- 4346 Clairesbrook Ln
- 4346 Clairesbrook Ln Unit 11
- 0 Jacobean Rd
- 2609 Jacobean Rd
- 2614 Jacobean Rd
- 4416 Morlowe Ct
- 4352 Clairesbrook Ln
- 2612 Jacobean Rd
- 2612 Jacobean Rd Unit ONE
- 4415 Morlowe Ct
- 4414 Morlowe Ct
- 4344 Clairesbrook Ln
- 2607 Jacobean Rd
- 4451 Lockett Trace Unit 1
- 4349 Clairesbrook Ln