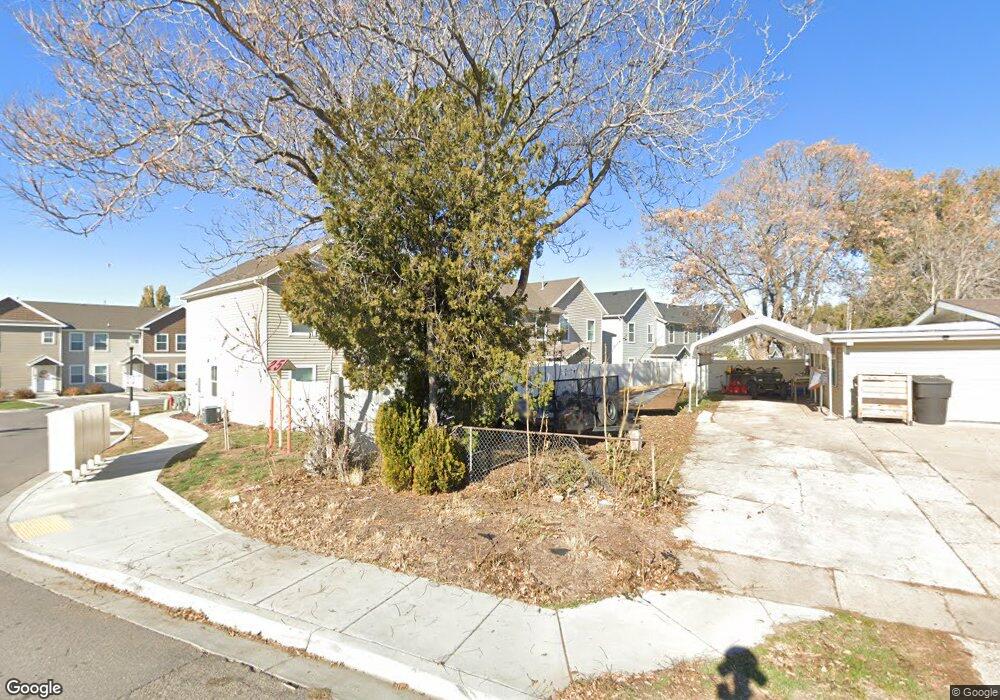
2613 N 500 W Sunset, UT 84015
Estimated Value: $319,000 - $330,000
3
Beds
3
Baths
1,300
Sq Ft
$251/Sq Ft
Est. Value
About This Home
This home is located at 2613 N 500 W, Sunset, UT 84015 and is currently estimated at $325,673, approximately $250 per square foot. 2613 N 500 W is a home located in Davis County with nearby schools including Fremont School, Sunset Junior High School, and Northridge High School.
Ownership History
Date
Name
Owned For
Owner Type
Purchase Details
Closed on
Jul 20, 2021
Sold by
Debruyn Eagan and Debruyn Sarah
Bought by
Debruyn Eagan and Debruyn Sarah Young
Current Estimated Value
Home Financials for this Owner
Home Financials are based on the most recent Mortgage that was taken out on this home.
Original Mortgage
$205,000
Outstanding Balance
$186,289
Interest Rate
3%
Mortgage Type
New Conventional
Estimated Equity
$139,384
Purchase Details
Closed on
Sep 30, 2019
Sold by
Masten Daniel and Masten Sharon
Bought by
Debruyn Meagan and Debruyn Sarah
Home Financials for this Owner
Home Financials are based on the most recent Mortgage that was taken out on this home.
Original Mortgage
$206,196
Interest Rate
3.5%
Mortgage Type
FHA
Purchase Details
Closed on
May 30, 2017
Sold by
Sunset Development Llc
Bought by
Masten Daniel and Maston Sharon
Home Financials for this Owner
Home Financials are based on the most recent Mortgage that was taken out on this home.
Original Mortgage
$148,702
Interest Rate
3.91%
Mortgage Type
FHA
Create a Home Valuation Report for This Property
The Home Valuation Report is an in-depth analysis detailing your home's value as well as a comparison with similar homes in the area
Home Values in the Area
Average Home Value in this Area
Purchase History
| Date | Buyer | Sale Price | Title Company |
|---|---|---|---|
| Debruyn Eagan | -- | Title Guarantee Layton | |
| Debruyn Meagan | -- | Metro National Title | |
| Masten Daniel | -- | -- |
Source: Public Records
Mortgage History
| Date | Status | Borrower | Loan Amount |
|---|---|---|---|
| Open | Debruyn Eagan | $205,000 | |
| Closed | Debruyn Meagan | $206,196 | |
| Previous Owner | Masten Daniel | $148,702 |
Source: Public Records
Tax History Compared to Growth
Tax History
| Year | Tax Paid | Tax Assessment Tax Assessment Total Assessment is a certain percentage of the fair market value that is determined by local assessors to be the total taxable value of land and additions on the property. | Land | Improvement |
|---|---|---|---|---|
| 2025 | $1,749 | $159,500 | $53,900 | $105,600 |
| 2024 | $1,688 | $154,000 | $40,700 | $113,300 |
| 2023 | $1,647 | $274,000 | $78,000 | $196,000 |
| 2022 | $1,668 | $150,150 | $38,500 | $111,650 |
| 2021 | $1,505 | $213,000 | $54,000 | $159,000 |
| 2020 | $1,308 | $182,000 | $48,000 | $134,000 |
| 2019 | $1,205 | $172,000 | $48,000 | $124,000 |
| 2018 | $1,067 | $149,000 | $24,000 | $125,000 |
| 2016 | $334 | $24,000 | $24,000 | $0 |
Source: Public Records
Map
Nearby Homes
- 2613 N 500 W Unit 51
- 2617 N 500 W Unit 50
- 2617 N 500 W
- 2621 N 500 W Unit 49
- 2621 N 500 W
- 2605 N 500 Place W
- 2608 N 525 W
- 2625 N 500 W
- 2601 N 500 W
- 2616 N 525 Trace W
- 2620 N 525 W
- 2604 N 525 Trace W
- 2629 N 500 Place W
- 2597 N 500 W
- 2598 N 525 W
- 2624 N 525 W Unit 69
- 2594 N 525 Trace W
- 2631 N 500 W
- 2631 N 500 W Unit 46
- 2618 N 525 W