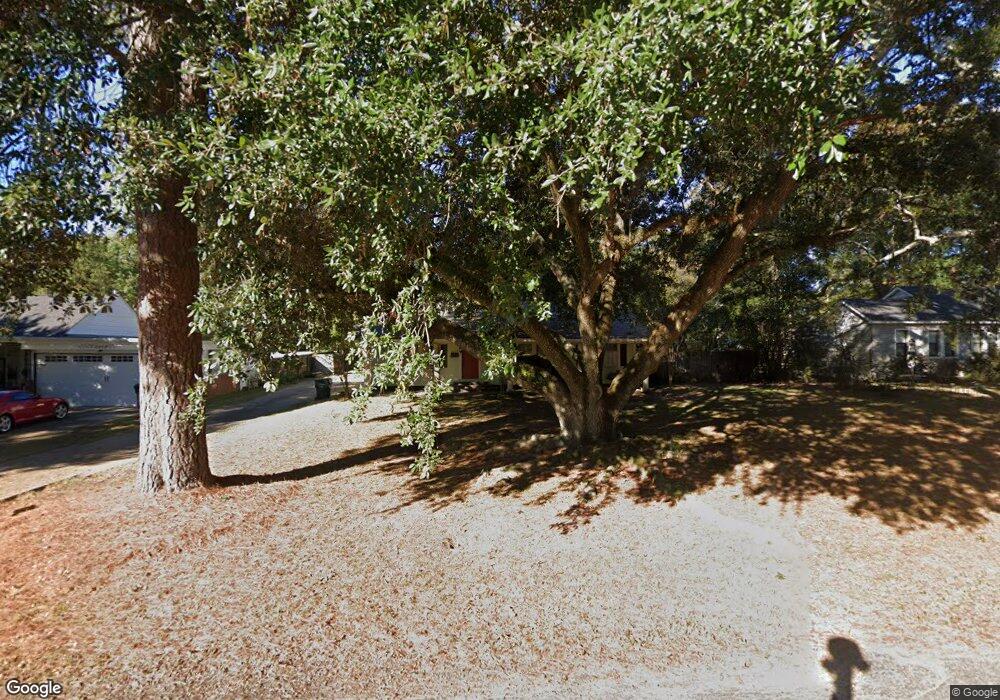
2613 N 9th St West Monroe, LA 71291
Estimated Value: $131,000 - $142,000
2
Beds
2
Baths
1,280
Sq Ft
$106/Sq Ft
Est. Value
About This Home
This home is located at 2613 N 9th St, West Monroe, LA 71291 and is currently estimated at $136,133, approximately $106 per square foot. 2613 N 9th St is a home located in Ouachita Parish with nearby schools including Highland Elementary School, West Monroe High School, and Claiborne Christian School.
Ownership History
Date
Name
Owned For
Owner Type
Purchase Details
Closed on
Oct 8, 2021
Sold by
Paxton Lindsey C and Moore Jonathan E
Bought by
Coon John F and Coon Judy C
Current Estimated Value
Purchase Details
Closed on
Oct 17, 2011
Sold by
Brister Gaspard Buffie Marie Davis and Brister Buffie Marie Davis
Bought by
Moore Jonathan Edward and Moore Lindsey Michelle Coon
Home Financials for this Owner
Home Financials are based on the most recent Mortgage that was taken out on this home.
Original Mortgage
$95,515
Interest Rate
4.25%
Mortgage Type
FHA
Purchase Details
Closed on
Jan 28, 2008
Sold by
Davis Brister Buffi Marie
Bought by
Impact Properties Llc
Purchase Details
Closed on
Jan 12, 2007
Sold by
Eason Michael Kevin and Sanders Eason Shelly Reed
Bought by
Davis Brister Buffi Marie
Home Financials for this Owner
Home Financials are based on the most recent Mortgage that was taken out on this home.
Original Mortgage
$97,000
Interest Rate
6.1%
Mortgage Type
New Conventional
Create a Home Valuation Report for This Property
The Home Valuation Report is an in-depth analysis detailing your home's value as well as a comparison with similar homes in the area
Home Values in the Area
Average Home Value in this Area
Purchase History
| Date | Buyer | Sale Price | Title Company |
|---|---|---|---|
| Coon John F | $100,000 | None Available | |
| Moore Jonathan Edward | $98,000 | None Available | |
| Impact Properties Llc | $97,000 | None Available | |
| Davis Brister Buffi Marie | $97,000 | None Available |
Source: Public Records
Mortgage History
| Date | Status | Borrower | Loan Amount |
|---|---|---|---|
| Previous Owner | Moore Jonathan Edward | $95,515 | |
| Previous Owner | Davis Brister Buffi Marie | $97,000 |
Source: Public Records
Tax History Compared to Growth
Tax History
| Year | Tax Paid | Tax Assessment Tax Assessment Total Assessment is a certain percentage of the fair market value that is determined by local assessors to be the total taxable value of land and additions on the property. | Land | Improvement |
|---|---|---|---|---|
| 2024 | $184 | $9,081 | $1,875 | $7,206 |
| 2023 | $184 | $9,019 | $1,862 | $7,157 |
| 2022 | $701 | $9,081 | $1,875 | $7,206 |
| 2021 | $701 | $9,081 | $1,875 | $7,206 |
| 2020 | $701 | $9,081 | $1,875 | $7,206 |
| 2019 | $701 | $9,081 | $1,875 | $7,206 |
| 2018 | $186 | $9,081 | $1,875 | $7,206 |
| 2017 | $701 | $9,081 | $1,875 | $7,206 |
| 2016 | $701 | $9,081 | $1,875 | $7,206 |
| 2015 | $185 | $9,081 | $1,875 | $7,206 |
| 2014 | $185 | $9,081 | $1,875 | $7,206 |
| 2013 | $185 | $9,081 | $1,875 | $7,206 |
Source: Public Records
Map
Nearby Homes
- 2514 Swiss St
- 1106 Otis St
- 2404 N 10th St
- 1304 Wellerman Rd
- 3005 N 8th St
- 1018 Ridge Ave
- 306 Splane Dr
- 1425 Elizabeth St
- 0 Gulpha Dr
- 200 Ferndale Ave
- 1115 Tulane Ave
- 412 Maridale Dr
- 1300 Ridge Ave
- 1516 Wellerman Rd
- 110 Ada St
- 118 Arlington Place
- 112 Mallard Ave
- 3655 Whites Ferry Rd
- 606 Nichols Place
- 603 Nichols Dr