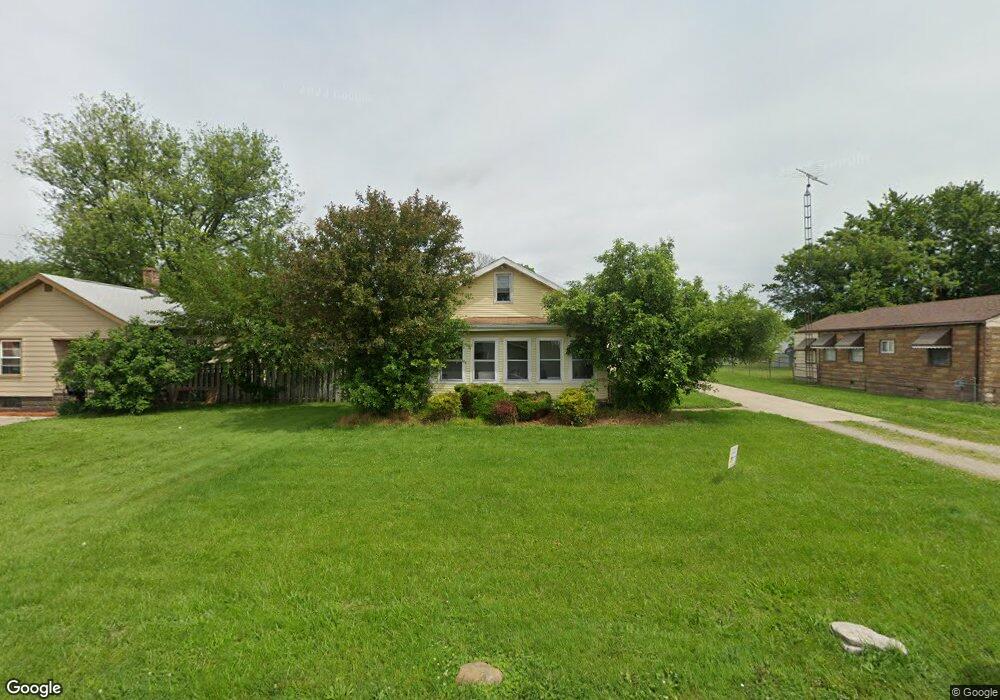
2613 Northvale Dr Oregon, OH 43616
Estimated Value: $112,000 - $185,000
3
Beds
1
Bath
1,150
Sq Ft
$126/Sq Ft
Est. Value
About This Home
This home is located at 2613 Northvale Dr, Oregon, OH 43616 and is currently estimated at $145,449, approximately $126 per square foot. 2613 Northvale Dr is a home located in Lucas County with nearby schools including Kenmore Preparatory Academy dba Toledo Preparatory Academy, First St. John Day School, and Kateri Catholic Academy.
Ownership History
Date
Name
Owned For
Owner Type
Purchase Details
Closed on
Jul 18, 2008
Sold by
Westhaven Group Llc and Kowalski Gerald R
Bought by
Vtodd Rentals Llc
Current Estimated Value
Purchase Details
Closed on
Feb 24, 2004
Sold by
Ulmer Scot F
Bought by
Pecina Lily O
Home Financials for this Owner
Home Financials are based on the most recent Mortgage that was taken out on this home.
Original Mortgage
$94,250
Interest Rate
9.75%
Mortgage Type
Seller Take Back
Purchase Details
Closed on
Sep 11, 2003
Sold by
Manufacturers & Traders Trust Co
Bought by
The Westhaven Group Llc
Purchase Details
Closed on
Feb 11, 2003
Sold by
Emerick Robert E
Bought by
Manufacturers & Traders Trust Co and Securitization Series 1998-1
Purchase Details
Closed on
Jul 16, 2001
Sold by
Emerick Alma K
Bought by
Emerick Robert E
Purchase Details
Closed on
Sep 13, 1989
Sold by
Emerick Robert E
Create a Home Valuation Report for This Property
The Home Valuation Report is an in-depth analysis detailing your home's value as well as a comparison with similar homes in the area
Home Values in the Area
Average Home Value in this Area
Purchase History
| Date | Buyer | Sale Price | Title Company |
|---|---|---|---|
| Vtodd Rentals Llc | $53,900 | Louisville Title Agency For | |
| Pecina Lily O | $99,000 | -- | |
| The Westhaven Group Llc | $39,000 | -- | |
| Manufacturers & Traders Trust Co | $65,566 | -- | |
| Emerick Robert E | -- | -- | |
| -- | -- | -- |
Source: Public Records
Mortgage History
| Date | Status | Borrower | Loan Amount |
|---|---|---|---|
| Previous Owner | Pecina Lily O | $94,250 |
Source: Public Records
Tax History
| Year | Tax Paid | Tax Assessment Tax Assessment Total Assessment is a certain percentage of the fair market value that is determined by local assessors to be the total taxable value of land and additions on the property. | Land | Improvement |
|---|---|---|---|---|
| 2025 | -- | $39,515 | $6,475 | $33,040 |
| 2024 | $957 | $39,515 | $6,475 | $33,040 |
| 2023 | $1,708 | $29,995 | $5,565 | $24,430 |
| 2022 | $1,721 | $29,995 | $5,565 | $24,430 |
| 2021 | $1,735 | $29,995 | $5,565 | $24,430 |
| 2020 | $1,613 | $24,780 | $4,550 | $20,230 |
| 2019 | $1,568 | $24,780 | $4,550 | $20,230 |
| 2018 | $1,473 | $24,780 | $4,550 | $20,230 |
| 2017 | $1,412 | $20,895 | $4,515 | $16,380 |
| 2016 | $1,394 | $59,700 | $12,900 | $46,800 |
| 2015 | $1,385 | $59,700 | $12,900 | $46,800 |
| 2014 | $1,282 | $20,480 | $4,410 | $16,070 |
| 2013 | $1,282 | $20,480 | $4,410 | $16,070 |
Source: Public Records
Map
Nearby Homes
- 2719 Northvale Dr
- 2716 Hayden St
- 2809 Starr Ave
- 2649 Luverne Ave
- 240 Ponderosa Dr
- 2247 Marcy St
- 674 Sylvandale Ave
- 2329 Seaman St
- 25 Taylor Rd
- 507 S Goodyear St
- 509 Dover Place
- 2121 Nevada St
- 755 Dearborn Ave
- 577 Dover Place
- 343 Heffner St
- 331 Heffner St
- 2017 Kelsey Ave
- 2074 Price St
- 130 Burger St
- 1943 Starr Ave
- 2609 Northvale Dr
- 2623 Northvale Dr
- 2625 Northvale Dr
- 2618 Bleeker St
- 2608 Bleeker St
- 2614 Bleeker St
- 2622 Bleeker St
- 2631 Northvale Dr
- 303 S Wheeling St
- 2614 Northvale Dr
- 2626 Bleeker St
- 2622 Northvale Dr
- 2637 Northvale Dr
- 2632 Bleeker St
- 2628 Northvale Dr
- 2557 Northvale Dr
- 2626 Northvale Dr
- 2636 Bleeker St
- 2639 Northvale Dr
- 2634 Northvale Dr
Your Personal Tour Guide
Ask me questions while you tour the home.