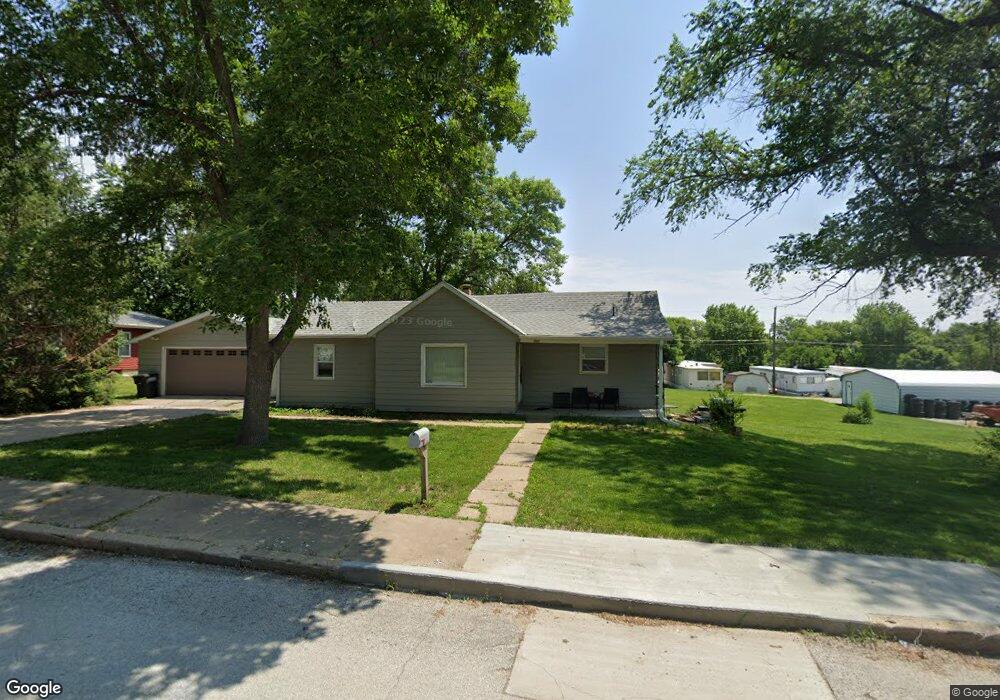
2613 O St Auburn, NE 68305
Estimated Value: $78,000 - $107,094
2
Beds
1
Bath
816
Sq Ft
$112/Sq Ft
Est. Value
About This Home
This home is located at 2613 O St, Auburn, NE 68305 and is currently estimated at $91,524, approximately $112 per square foot. 2613 O St is a home located in Nemaha County with nearby schools including Calvert Elementary School, Auburn Middle School, and Auburn High School.
Ownership History
Date
Name
Owned For
Owner Type
Purchase Details
Closed on
Oct 16, 2024
Sold by
Lakeview Loan Servicing Llc
Bought by
Leslie Gary and Leslie Edith
Current Estimated Value
Purchase Details
Closed on
May 17, 2024
Sold by
Shannon Liliana E
Bought by
Lakeview Loan Servicing Llc
Purchase Details
Closed on
Sep 18, 2020
Sold by
Mellage Scott and Mellage Mary
Bought by
Courtney Jami Cura
Home Financials for this Owner
Home Financials are based on the most recent Mortgage that was taken out on this home.
Original Mortgage
$93,279
Interest Rate
2.8%
Mortgage Type
FHA
Purchase Details
Closed on
Oct 18, 2007
Sold by
Carr Irene M and Carr Sidney M
Bought by
Mellage Scott
Home Financials for this Owner
Home Financials are based on the most recent Mortgage that was taken out on this home.
Original Mortgage
$57,000
Interest Rate
6.37%
Mortgage Type
Unknown
Create a Home Valuation Report for This Property
The Home Valuation Report is an in-depth analysis detailing your home's value as well as a comparison with similar homes in the area
Home Values in the Area
Average Home Value in this Area
Purchase History
| Date | Buyer | Sale Price | Title Company |
|---|---|---|---|
| Leslie Gary | $76,250 | Platinum Title & Escrow | |
| Lakeview Loan Servicing Llc | $76,250 | None Listed On Document | |
| Courtney Jami Cura | $95,000 | Charter T&E Svcs | |
| Cura Jemi | $95,000 | Charter T&E Svcs Inc | |
| Mellage Scott | $53,000 | -- |
Source: Public Records
Mortgage History
| Date | Status | Borrower | Loan Amount |
|---|---|---|---|
| Previous Owner | Cura Jemi | $93,279 | |
| Previous Owner | Mellage Scott | $57,000 |
Source: Public Records
Tax History Compared to Growth
Tax History
| Year | Tax Paid | Tax Assessment Tax Assessment Total Assessment is a certain percentage of the fair market value that is determined by local assessors to be the total taxable value of land and additions on the property. | Land | Improvement |
|---|---|---|---|---|
| 2024 | $1,786 | $102,446 | $31,500 | $70,946 |
| 2023 | $1,617 | $83,197 | $31,500 | $51,697 |
| 2022 | $1,610 | $83,197 | $31,500 | $51,697 |
| 2021 | $1,591 | $83,197 | $31,500 | $51,697 |
| 2020 | $1,617 | $83,197 | $31,500 | $51,697 |
| 2019 | $1,116 | $56,205 | $13,300 | $42,905 |
| 2017 | $1,067 | $56,205 | $13,300 | $42,905 |
| 2016 | $1,067 | $56,205 | $13,300 | $42,905 |
| 2015 | $1,067 | $56,205 | $13,300 | $42,905 |
| 2014 | $1,097 | $56,205 | $13,300 | $42,905 |
Source: Public Records
Map
Nearby Homes
- 1709 23rd St
- 2023 K St
- 1514 19th St
- 2559 Mcconnell Ave Unit 52
- 2420 Whitlow Ave Unit 1
- 2440 Whitlow Ave Unit 1
- 2460 Whitlow Ave Unit 1
- 2480 Whitlow Ave Unit 1
- 2500 Whitlow Ave Unit 1
- 2300 Whitlow Ave Unit 1
- 1720 K St
- 16 Th St
- 1614 17th St
- 1411 O St
- 1420 14th St
- 1105 13th St
- 1202 13th St
- 1215 Central Ave
- 1410 Central Ave
- 16th and T St