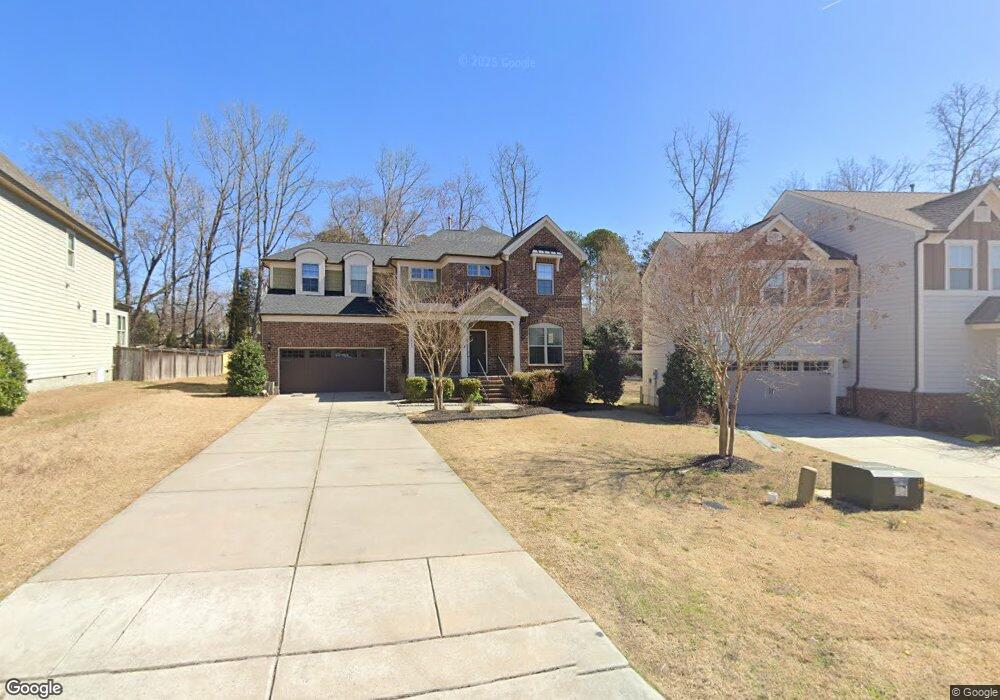
2613 Olive Chapel Rd Apex, NC 27502
West Apex NeighborhoodEstimated Value: $934,000 - $3,307,628
6
Beds
8
Baths
6,383
Sq Ft
$320/Sq Ft
Est. Value
About This Home
This home is located at 2613 Olive Chapel Rd, Apex, NC 27502 and is currently estimated at $2,039,543, approximately $319 per square foot. 2613 Olive Chapel Rd is a home located in Wake County with nearby schools including Olive Chapel Elementary School, Lufkin Road Middle School, and Apex Friendship High School.
Ownership History
Date
Name
Owned For
Owner Type
Purchase Details
Closed on
Jun 16, 2010
Sold by
Adams Steven M and Adams Julie M
Bought by
Rubin Beverly L
Current Estimated Value
Purchase Details
Closed on
Feb 1, 2002
Sold by
Gallagher Leo
Bought by
Calder Madeleine J
Purchase Details
Closed on
Jul 21, 2001
Sold by
Calder Madeleine J and Gallagher Leo
Bought by
Adams Steven M and Adams Julie M
Create a Home Valuation Report for This Property
The Home Valuation Report is an in-depth analysis detailing your home's value as well as a comparison with similar homes in the area
Home Values in the Area
Average Home Value in this Area
Purchase History
| Date | Buyer | Sale Price | Title Company |
|---|---|---|---|
| Rubin Beverly L | $1,090,000 | None Available | |
| Calder Madeleine J | -- | -- | |
| Adams Steven M | $557,500 | -- |
Source: Public Records
Tax History Compared to Growth
Tax History
| Year | Tax Paid | Tax Assessment Tax Assessment Total Assessment is a certain percentage of the fair market value that is determined by local assessors to be the total taxable value of land and additions on the property. | Land | Improvement |
|---|---|---|---|---|
| 2025 | $17,200 | $2,686,048 | $1,855,400 | $830,648 |
| 2024 | $16,700 | $2,686,048 | $1,855,400 | $830,648 |
| 2023 | $10,791 | $1,381,366 | $792,720 | $588,646 |
| 2022 | $9,996 | $1,381,366 | $792,720 | $588,646 |
| 2021 | $9,727 | $1,381,366 | $792,720 | $588,646 |
| 2020 | $9,565 | $1,381,366 | $792,720 | $588,646 |
| 2019 | $8,882 | $1,085,054 | $627,320 | $457,734 |
| 2018 | $8,162 | $1,085,054 | $627,320 | $457,734 |
| 2017 | $7,735 | $1,085,054 | $627,320 | $457,734 |
| 2016 | $7,577 | $1,085,054 | $627,320 | $457,734 |
| 2015 | $7,135 | $1,024,408 | $587,500 | $436,908 |
| 2014 | $6,761 | $1,024,408 | $587,500 | $436,908 |
Source: Public Records
Map
Nearby Homes
- 2842 Lemnos Dr
- 1508 Braden Overlook Ct
- 2528 Olive Chapel Rd
- 2530 Olive Chapel Rd
- 2524 Olive Chapel Rd
- 2853 Farmhouse Dr
- 2837 Farmhouse Dr
- 2835 Farmhouse Dr
- 2829 Farmhouse Dr
- 2805 Farmhouse Dr
- 2808 Farmhouse Dr
- 2538 Olive Chapel Rd
- 2848 Farmhouse Dr
- 2819 Farmhouse Dr
- 1413 Rowboat Rd
- 1426 Rowboat Rd
- 1382 Rowboat Rd
- 1381 Rowboat Rd
- 1385 Rowboat Rd
- 2806 Farmhouse Dr
- 2838 Lemnos Dr
- 2846 Lemnos Dr Unit Lot 62
- 2834 Lemnos Dr
- 1541 Thassos Dr
- 2830 Lemnos Dr
- 2850 Lemnos Dr
- 1537 Thassos Dr
- 1533 Thassos Dr
- 1532 Braden Overlook Ct
- 1528 Braden Overlook Ct
- 1513 Thassos Dr Unit AR Lot 96
- 2835 Lemnos Dr
- 1529 Thassos Dr
- 2843 Lemnos Dr
- 2816 Lemnos Dr
- 1529 Braden Overlook Ct
- 2831 Lemnos Dr Unit LOT 75
- 2851 Lemnos Dr Unit Lot 78
- 2856 Lemnos Dr Unit AR Lot 85
- 1547 Baxter Ridge Ct