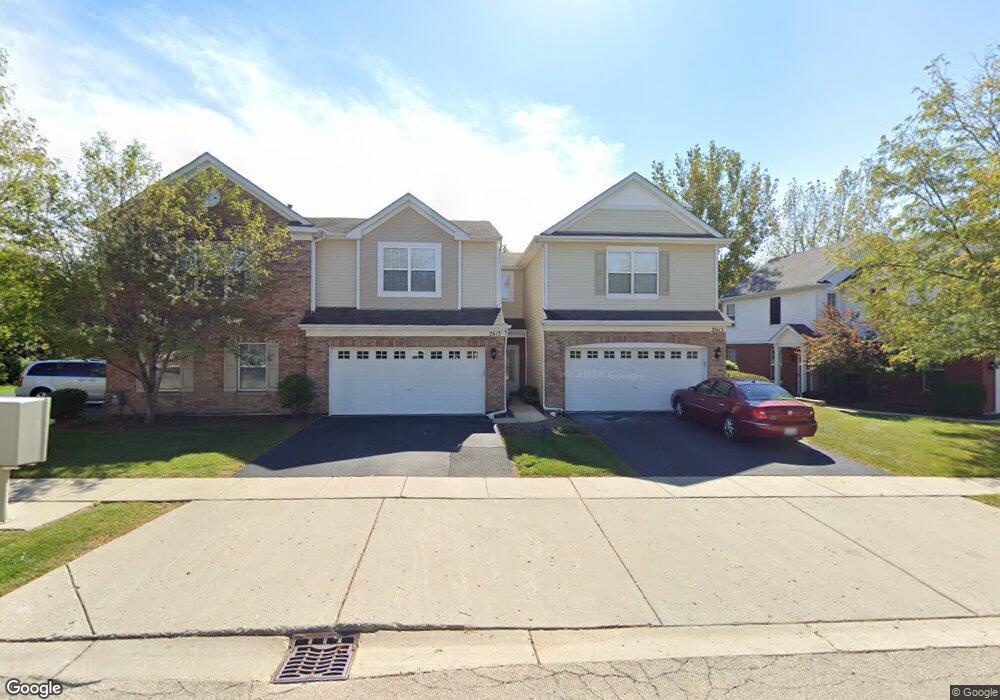
2613 Pondview Dr Algonquin, IL 60102
Far West Algonquin NeighborhoodEstimated Value: $277,179 - $300,000
2
Beds
2
Baths
1,567
Sq Ft
$185/Sq Ft
Est. Value
About This Home
This home is located at 2613 Pondview Dr, Algonquin, IL 60102 and is currently estimated at $290,545, approximately $185 per square foot. 2613 Pondview Dr is a home located in McHenry County with nearby schools including Westfield Community School, Lincoln Prairie Elementary School, and Harry D Jacobs High School.
Ownership History
Date
Name
Owned For
Owner Type
Purchase Details
Closed on
Dec 11, 2023
Sold by
Bhungalia Naren N and Desai Ketki
Bought by
Trublowski Justyna and Trublowski Mariusz
Current Estimated Value
Home Financials for this Owner
Home Financials are based on the most recent Mortgage that was taken out on this home.
Original Mortgage
$120,000
Outstanding Balance
$117,813
Interest Rate
7.99%
Mortgage Type
New Conventional
Estimated Equity
$172,732
Purchase Details
Closed on
Apr 6, 2006
Sold by
Thakker Dharmendra and Thakker Priti
Bought by
Desai Ketki and Bhungalia Naren N
Home Financials for this Owner
Home Financials are based on the most recent Mortgage that was taken out on this home.
Original Mortgage
$183,600
Interest Rate
6.34%
Mortgage Type
Fannie Mae Freddie Mac
Purchase Details
Closed on
Sep 1, 2004
Sold by
Centex Homes
Bought by
Thakker Dharmenda and Thakker Priti
Home Financials for this Owner
Home Financials are based on the most recent Mortgage that was taken out on this home.
Original Mortgage
$149,924
Interest Rate
5.93%
Mortgage Type
Unknown
Create a Home Valuation Report for This Property
The Home Valuation Report is an in-depth analysis detailing your home's value as well as a comparison with similar homes in the area
Home Values in the Area
Average Home Value in this Area
Purchase History
| Date | Buyer | Sale Price | Title Company |
|---|---|---|---|
| Trublowski Justyna | $240,000 | Fidelity National Title | |
| Desai Ketki | $204,000 | 1St American Title | |
| Thakker Dharmenda | $187,405 | -- |
Source: Public Records
Mortgage History
| Date | Status | Borrower | Loan Amount |
|---|---|---|---|
| Open | Trublowski Justyna | $120,000 | |
| Previous Owner | Desai Ketki | $183,600 | |
| Previous Owner | Thakker Dharmenda | $149,924 |
Source: Public Records
Tax History
| Year | Tax Paid | Tax Assessment Tax Assessment Total Assessment is a certain percentage of the fair market value that is determined by local assessors to be the total taxable value of land and additions on the property. | Land | Improvement |
|---|---|---|---|---|
| 2024 | $6,383 | $81,590 | $15,898 | $65,692 |
| 2023 | $6,109 | $72,972 | $14,219 | $58,753 |
| 2022 | $5,189 | $60,507 | $11,245 | $49,262 |
| 2021 | $5,002 | $56,369 | $10,476 | $45,893 |
| 2020 | $4,882 | $54,373 | $10,105 | $44,268 |
| 2019 | $4,779 | $52,042 | $9,672 | $42,370 |
| 2018 | $4,445 | $46,637 | $8,935 | $37,702 |
| 2017 | $4,375 | $43,935 | $8,417 | $35,518 |
| 2016 | $4,333 | $41,207 | $7,894 | $33,313 |
| 2013 | -- | $52,601 | $7,364 | $45,237 |
Source: Public Records
Map
Nearby Homes
- 895 Eineke Blvd
- 1453 Millbrook Dr
- 2956 Harnish Dr
- 2666 Loren Ct Unit 341
- 1552 Matthew Dr Unit 1552
- 0 Boyer Rd Unit MRD11328255
- 2161 Burnham Ct
- 2051 Carlisle St
- 511 Greens View Dr
- 2704 Bay View Cir
- 2232 Dawson Ln Unit 296
- 3520 Bunker Hill Dr
- 491 Saratoga Cir
- 1850 White Oak Dr
- 3650 Wintergreen Terrace
- 1181 Glenmont St
- 1221 Glenmont St
- 325 Stonegate Rd Unit 1
- 16 Springbrook Ln
- 1231 Glenmont St
- 2613 Pond View Dr
- 2611 Pondview Dr
- 2615 Pondview Dr
- 2621 Pondview Dr
- 2621 Pond View Dr
- 2605 Pondview Dr
- 2623 Pondview Dr
- 2603 Pondview Dr
- 2625 Pondview Dr
- 2610 Pondview Dr
- 2601 Pondview Dr
- 2627 Pondview Dr
- 2612 Pondview Dr
- 2620 Pondview Dr
- 2600 Pondview Dr
- 2614 Pondview Dr
- 2622 Pondview Dr
- 2602 Pondview Dr
- 2624 Pond View Dr Unit 2624
- 2624 Pondview Dr
Your Personal Tour Guide
Ask me questions while you tour the home.