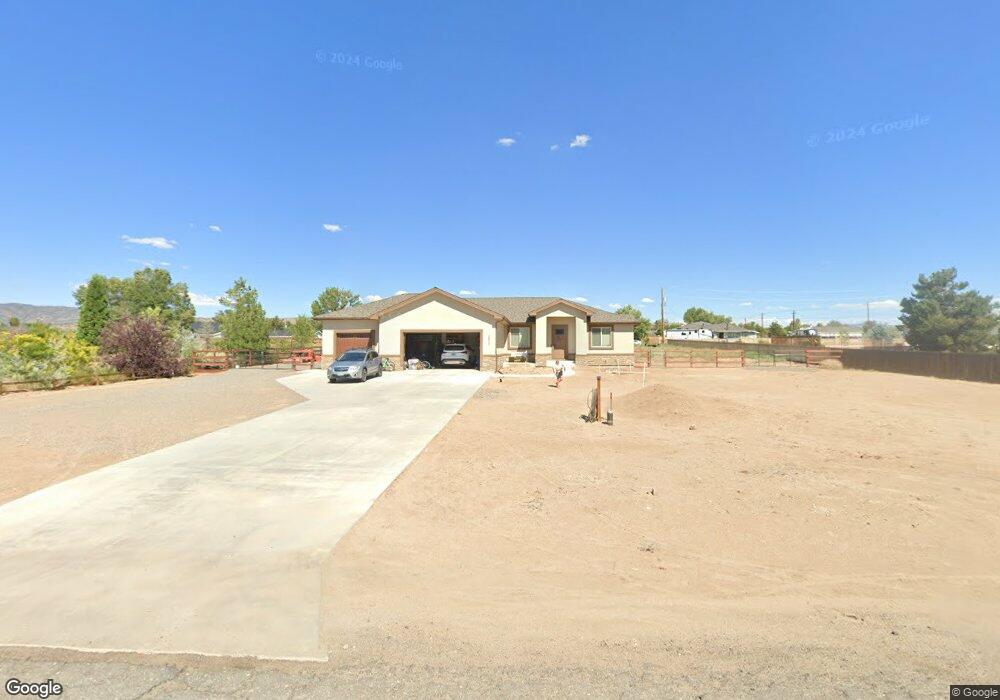
2613 Squires St Minden, NV 89423
Estimated Value: $854,000 - $1,061,000
Studio
--
Bath
2,306
Sq Ft
$407/Sq Ft
Est. Value
About This Home
This home is located at 2613 Squires St, Minden, NV 89423 and is currently estimated at $939,518, approximately $407 per square foot. 2613 Squires St is a home located in Douglas County with nearby schools including Pinon Hills Elementary School, Carson Valley Middle School, and Douglas County High School.
Ownership History
Date
Name
Owned For
Owner Type
Purchase Details
Closed on
Apr 24, 2020
Sold by
Mahoney Christopher R
Bought by
Mahoney Christopher R and Mahoney Allison
Current Estimated Value
Home Financials for this Owner
Home Financials are based on the most recent Mortgage that was taken out on this home.
Original Mortgage
$290,000
Outstanding Balance
$256,227
Interest Rate
3.6%
Mortgage Type
VA
Estimated Equity
$683,291
Purchase Details
Closed on
Mar 18, 2015
Sold by
Mahoney Allision
Bought by
Mahoney Christopher
Purchase Details
Closed on
Sep 30, 2014
Sold by
Us Bank Na
Bought by
Us Bank Na and Estate Of Ronald Craig Dougan
Purchase Details
Closed on
Apr 13, 2011
Sold by
Dougan Ronald Craig
Bought by
Dougan Ronald Craig
Create a Home Valuation Report for This Property
The Home Valuation Report is an in-depth analysis detailing your home's value as well as a comparison with similar homes in the area
Home Values in the Area
Average Home Value in this Area
Purchase History
| Date | Buyer | Sale Price | Title Company |
|---|---|---|---|
| Mahoney Christopher R | -- | First American Title Ins Co | |
| Mahoney Christopher | -- | Western Title Company Inc | |
| Mahoney Christopher R | $73,000 | Western Title Company Inc | |
| Us Bank Na | -- | None Available | |
| Dougan Ronald Craig | -- | None Available |
Source: Public Records
Mortgage History
| Date | Status | Borrower | Loan Amount |
|---|---|---|---|
| Open | Mahoney Christopher R | $290,000 |
Source: Public Records
Tax History
| Year | Tax Paid | Tax Assessment Tax Assessment Total Assessment is a certain percentage of the fair market value that is determined by local assessors to be the total taxable value of land and additions on the property. | Land | Improvement |
|---|---|---|---|---|
| 2026 | $4,452 | $199,567 | $63,000 | $136,567 |
| 2025 | $4,323 | $197,198 | $57,750 | $139,448 |
| 2024 | $4,197 | $192,082 | $52,500 | $139,582 |
| 2023 | $4,197 | $183,088 | $52,500 | $130,588 |
| 2022 | $4,075 | $167,770 | $45,500 | $122,270 |
| 2021 | $3,956 | $157,684 | $42,000 | $115,684 |
| 2020 | $3,841 | $152,043 | $38,500 | $113,543 |
| 2019 | $3,729 | $144,583 | $33,250 | $111,333 |
| 2018 | $3,620 | $133,996 | $27,300 | $106,696 |
| 2017 | $3,515 | $130,123 | $22,750 | $107,373 |
| 2016 | $3,426 | $39,524 | $22,750 | $16,774 |
| 2015 | $1,134 | $39,524 | $22,750 | $16,774 |
| 2014 | $653 | $22,750 | $22,750 | $0 |
Source: Public Records
Map
Nearby Homes
- 1564 Shirley St
- 1604 Chiquita St
- 2550 E Valley Rd
- 1621 Shirley St
- 2608 Gordon Ave
- 2704 Thirsty Magoo Ct
- 1688 Chiquita Cir
- 2740 E Valley Rd
- 2756 Squires St
- 2789 Squires St
- 2730 Kayne Ave
- 2800 Pamela Place
- 2770 Gordon Ave
- 2670 Buckboard Ct
- 1329 Dennis St
- 1324 Downs Dr
- 1537 W High Point Ct Unit Lot 3
- 2563 Precision Dr
- 1356 Stephanie Way
- 1372 Kim Place
- 2611 Squires St
- 1560 Johnson Ln
- 2625 Squires St
- 1559 Chiquita St
- 2618 Squires St
- 1565 Chiquita St
- 2620 Squires St
- 2620 Squires St Unit 78
- 1532 Johnson Ln
- 1568 Johnson Ln
- 2622 Squires St
- 1569 Chiquita St
- 1569 Chiquita St
- 2626 Squires St
- 1558 Chiquita St
- 1564 Chiquita St
- 1551 Johnson Ln
- 1573 Chiquita St
- 2633 Squires St
- 1570 Chiquita St
Your Personal Tour Guide
Ask me questions while you tour the home.