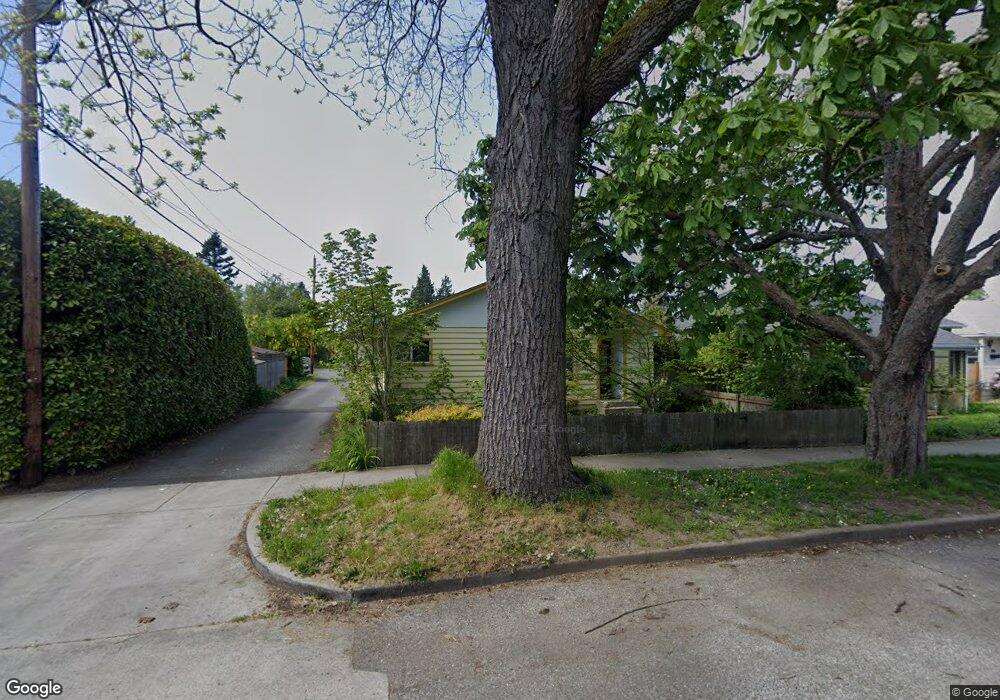
2613 Utter St Bellingham, WA 98225
Columbia NeighborhoodEstimated Value: $536,000 - $679,000
2
Beds
1
Bath
1,020
Sq Ft
$595/Sq Ft
Est. Value
About This Home
This home is located at 2613 Utter St, Bellingham, WA 98225 and is currently estimated at $606,956, approximately $595 per square foot. 2613 Utter St is a home located in Whatcom County with nearby schools including Columbia Elementary School, Whatcom Middle School, and Bellingham High School.
Ownership History
Date
Name
Owned For
Owner Type
Purchase Details
Closed on
Apr 3, 2008
Sold by
White Stuart B and White Linda R
Bought by
Jose Mialee and Solomons Daniel
Current Estimated Value
Purchase Details
Closed on
Mar 12, 2001
Sold by
Harper Steve Z
Bought by
White Stuart B and White Linda R
Home Financials for this Owner
Home Financials are based on the most recent Mortgage that was taken out on this home.
Original Mortgage
$74,900
Interest Rate
7.11%
Create a Home Valuation Report for This Property
The Home Valuation Report is an in-depth analysis detailing your home's value as well as a comparison with similar homes in the area
Home Values in the Area
Average Home Value in this Area
Purchase History
| Date | Buyer | Sale Price | Title Company |
|---|---|---|---|
| Jose Mialee | $230,280 | Whatcom Land Title | |
| White Stuart B | $107,000 | First American Title Insuran |
Source: Public Records
Mortgage History
| Date | Status | Borrower | Loan Amount |
|---|---|---|---|
| Previous Owner | White Stuart B | $74,900 |
Source: Public Records
Tax History Compared to Growth
Tax History
| Year | Tax Paid | Tax Assessment Tax Assessment Total Assessment is a certain percentage of the fair market value that is determined by local assessors to be the total taxable value of land and additions on the property. | Land | Improvement |
|---|---|---|---|---|
| 2024 | $4,423 | $554,168 | $270,928 | $283,240 |
| 2023 | $4,423 | $568,273 | $277,824 | $290,449 |
| 2022 | $3,283 | $489,892 | $239,504 | $250,388 |
| 2021 | $3,221 | $353,453 | $172,800 | $180,653 |
| 2020 | $3,251 | $327,271 | $160,000 | $167,271 |
| 2019 | $2,910 | $319,264 | $124,778 | $194,486 |
| 2018 | $2,931 | $286,585 | $112,028 | $174,557 |
| 2017 | $2,528 | $246,740 | $96,450 | $150,290 |
| 2016 | $2,212 | $222,421 | $86,550 | $135,871 |
| 2015 | $2,169 | $202,611 | $79,050 | $123,561 |
| 2014 | -- | $192,231 | $75,000 | $117,231 |
| 2013 | -- | $188,714 | $73,500 | $115,214 |
Source: Public Records
Map
Nearby Homes
- 2805 Walnut St
- 2600 Elm St
- 2500 Meridian St
- 2218 Jaeger St
- 3018 Elm St
- 1800 J St
- 3008 Meridian St
- 1410 J St
- 1315 Astor St
- 3000 Firwood Ave
- 1508 E Maplewood Ave
- 1200 W Holly St
- 2715 W Maplewood Ave Unit 122
- 2500 Cornwall Ave
- 3330 Northwest Ave
- 3045 Eldridge Ave Unit A
- 2829 Cottonwood Ave
- 3350 Northwest Ave Unit 1102
- 3025 Cedarwood Ave
- 2019 Cornwall Ave