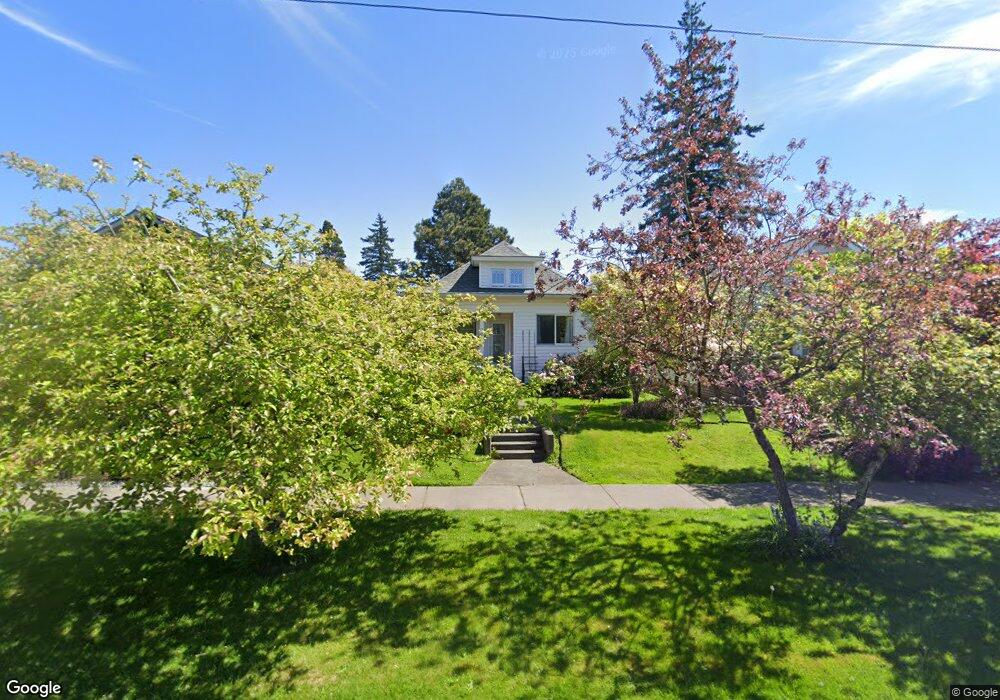
2614 Ellis St Bellingham, WA 98225
Sunnyland NeighborhoodEstimated Value: $479,000 - $497,000
2
Beds
1
Bath
820
Sq Ft
$597/Sq Ft
Est. Value
About This Home
This home is located at 2614 Ellis St, Bellingham, WA 98225 and is currently estimated at $489,773, approximately $597 per square foot. 2614 Ellis St is a home located in Whatcom County with nearby schools including Sunnyland Elementary School, Whatcom Middle School, and Bellingham High School.
Ownership History
Date
Name
Owned For
Owner Type
Purchase Details
Closed on
Jan 28, 2022
Sold by
Catherine Eileen Mcintyre Living Trust
Bought by
Ellsworth-Keller David and Ellsworth-Keller Ashleigh
Current Estimated Value
Home Financials for this Owner
Home Financials are based on the most recent Mortgage that was taken out on this home.
Original Mortgage
$377,330
Outstanding Balance
$350,968
Interest Rate
3.69%
Mortgage Type
New Conventional
Estimated Equity
$138,805
Purchase Details
Closed on
Sep 4, 2014
Sold by
Mcintyre Catherine Eileen and Mcintyre Catherine E
Bought by
Mcintyre Catherine Eileen
Create a Home Valuation Report for This Property
The Home Valuation Report is an in-depth analysis detailing your home's value as well as a comparison with similar homes in the area
Home Values in the Area
Average Home Value in this Area
Purchase History
| Date | Buyer | Sale Price | Title Company |
|---|---|---|---|
| Ellsworth-Keller David | $389,000 | New Title Company Name | |
| Mcintyre Catherine Eileen | -- | None Available |
Source: Public Records
Mortgage History
| Date | Status | Borrower | Loan Amount |
|---|---|---|---|
| Open | Ellsworth-Keller David | $377,330 |
Source: Public Records
Tax History Compared to Growth
Tax History
| Year | Tax Paid | Tax Assessment Tax Assessment Total Assessment is a certain percentage of the fair market value that is determined by local assessors to be the total taxable value of land and additions on the property. | Land | Improvement |
|---|---|---|---|---|
| 2024 | $3,766 | $471,757 | $246,304 | $225,453 |
| 2023 | $3,766 | $483,739 | $252,560 | $231,179 |
| 2022 | $3,074 | $417,024 | $217,728 | $199,296 |
| 2021 | $3,016 | $330,971 | $172,800 | $158,171 |
| 2020 | $3,063 | $306,455 | $160,000 | $146,455 |
| 2019 | $2,743 | $300,829 | $153,060 | $147,769 |
| 2018 | $2,762 | $270,047 | $137,420 | $132,627 |
| 2017 | $2,380 | $232,501 | $118,312 | $114,189 |
| 2016 | $2,084 | $209,401 | $106,168 | $103,233 |
| 2015 | $2,043 | $190,849 | $96,968 | $93,881 |
| 2014 | -- | $181,071 | $92,000 | $89,071 |
| 2013 | -- | $188,207 | $94,500 | $93,707 |
Source: Public Records
Map
Nearby Homes