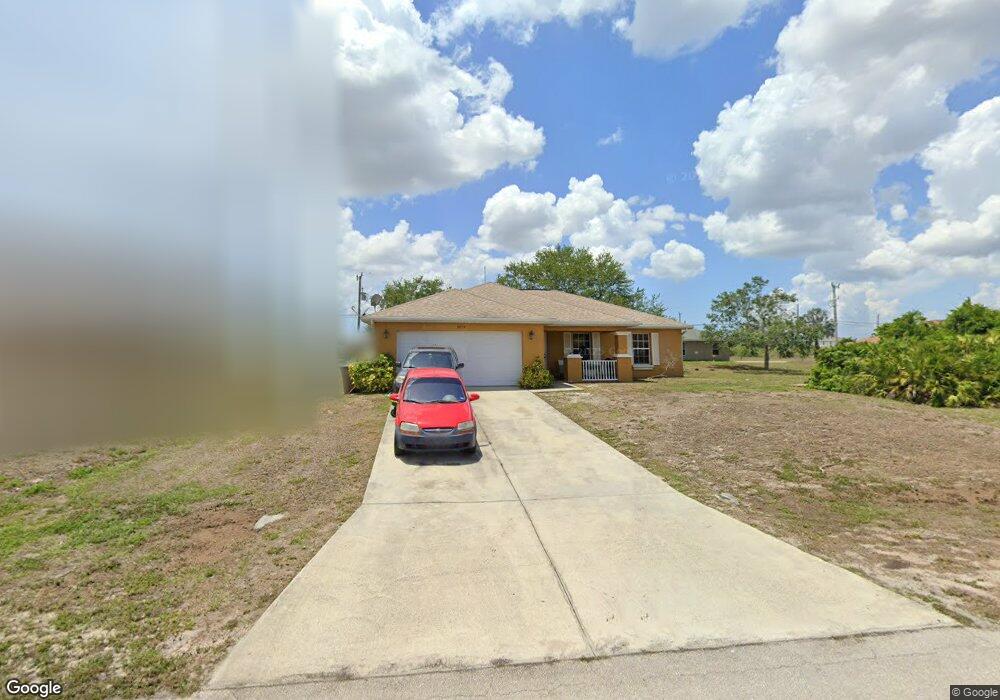
2614 NE 2nd Ave Unit 36 Cape Coral, FL 33909
Mariner NeighborhoodEstimated Value: $227,000 - $307,000
3
Beds
2
Baths
1,458
Sq Ft
$189/Sq Ft
Est. Value
About This Home
This home is located at 2614 NE 2nd Ave Unit 36, Cape Coral, FL 33909 and is currently estimated at $276,018, approximately $189 per square foot. 2614 NE 2nd Ave Unit 36 is a home located in Lee County with nearby schools including Dr. Carrie D. Robinson Littleton Elementary School, Caloosa Elementary School, and Tropic Isles Elementary School.
Ownership History
Date
Name
Owned For
Owner Type
Purchase Details
Closed on
Jun 11, 2012
Sold by
Dinh Ha Thanh and Tran Thu Trang
Bought by
Nguyen Hang P and Nguyen Son Diem
Current Estimated Value
Purchase Details
Closed on
Nov 9, 2010
Sold by
Aurora Loan Services Llc
Bought by
Dinh Ha Thanh and Tran Thu Trang
Purchase Details
Closed on
Oct 8, 2010
Sold by
Tan Thomas
Bought by
Aurora Loan Services Llc
Purchase Details
Closed on
Apr 29, 2005
Sold by
First Home Builders Of Florida
Bought by
Tan Thomas and Tan Diana H
Home Financials for this Owner
Home Financials are based on the most recent Mortgage that was taken out on this home.
Original Mortgage
$136,272
Interest Rate
7.12%
Mortgage Type
Fannie Mae Freddie Mac
Purchase Details
Closed on
Jan 3, 2003
Sold by
Lopez Amparo A
Bought by
Coral Paradise Inc
Create a Home Valuation Report for This Property
The Home Valuation Report is an in-depth analysis detailing your home's value as well as a comparison with similar homes in the area
Home Values in the Area
Average Home Value in this Area
Purchase History
| Date | Buyer | Sale Price | Title Company |
|---|---|---|---|
| Nguyen Hang P | $75,000 | Titleworks Of Sw Florida Inc | |
| Dinh Ha Thanh | $60,000 | Attorney | |
| Aurora Loan Services Llc | $38,500 | None Available | |
| Tan Thomas | $170,400 | First Home Title Inc | |
| Coral Paradise Inc | $5,000 | -- |
Source: Public Records
Mortgage History
| Date | Status | Borrower | Loan Amount |
|---|---|---|---|
| Previous Owner | Tan Thomas | $136,272 | |
| Closed | Tan Thomas | $34,068 |
Source: Public Records
Tax History Compared to Growth
Tax History
| Year | Tax Paid | Tax Assessment Tax Assessment Total Assessment is a certain percentage of the fair market value that is determined by local assessors to be the total taxable value of land and additions on the property. | Land | Improvement |
|---|---|---|---|---|
| 2025 | $4,207 | $207,685 | $34,723 | $172,512 |
| 2024 | $3,801 | $195,393 | -- | -- |
| 2023 | $3,801 | $177,630 | $0 | $0 |
| 2022 | $3,514 | $161,482 | $0 | $0 |
| 2021 | $3,121 | $146,802 | $7,500 | $139,302 |
| 2020 | $3,035 | $137,273 | $7,725 | $129,548 |
| 2019 | $2,935 | $133,236 | $10,000 | $123,236 |
| 2018 | $2,934 | $134,038 | $10,000 | $124,038 |
| 2017 | $2,798 | $128,394 | $6,800 | $121,594 |
| 2016 | $2,553 | $112,896 | $6,800 | $106,096 |
| 2015 | $2,358 | $98,703 | $6,200 | $92,503 |
| 2014 | $2,204 | $93,889 | $5,640 | $88,249 |
| 2013 | -- | $80,010 | $4,200 | $75,810 |
Source: Public Records
Map
Nearby Homes
- 2603 NE 2nd Place
- 2610 NE 1st Place
- 2526 NE 2nd Place
- 2602 NE 1st Place
- 305 NE 27th St
- 2532 NE 1st Place
- 2703 NE 1st Ave
- 2720 NE 1st Place
- 2521 NE 1st Place
- 2730 NE 2nd Place
- 108 NE 27th Terrace
- 204 NE 25th Terrace
- 2737 NE 2nd Place
- 322 NE 27th St
- 37 NE 27th Terrace
- 329 NE 27th St Unit 36
- 318 NE 25th Terrace
- 303 NE 25th St
- 2804 NE 3rd Ave
- 315 NE 25th St
- 2610 NE 2nd Ave
- 2613 NE 1st Place Unit 36
- 2613 NE 1st Place
- 2617 NE 1st Place
- 2609 NE 1st Place
- 2622 NE 2nd Ave
- 2606 NE 2nd Ave
- 2613 NE 2nd Ave
- 2609 NE 2nd Ave
- 2617 NE 2nd Ave
- 2621 NE 1st Place
- 2621 NE 2nd Ave
- 2700 NE 2nd Ave
- 2701 NE 1st Place
- 2601 NE 2nd Ave
- 2701 NE 2nd Ave
- 2614 NE 2nd Place
- 2704 NE 2nd Ave
- 2530 NE 2nd Ave
- 2618 NE 1st Place Unit 21