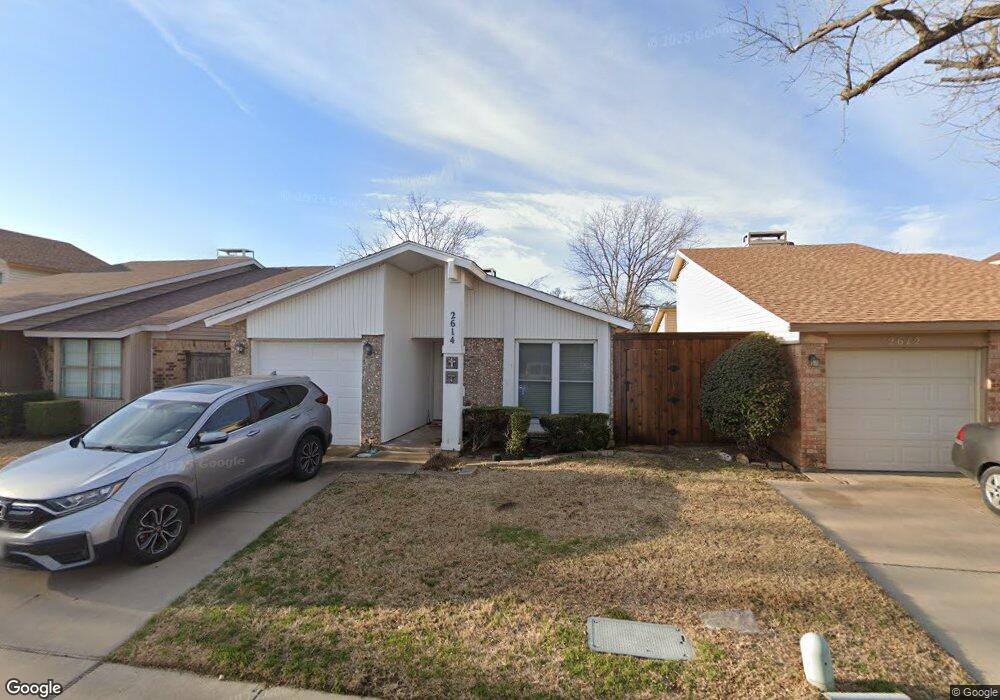
2614 Via Los Altos Carrollton, TX 75006
Southeast Carrollton NeighborhoodEstimated Value: $264,436 - $288,000
2
Beds
2
Baths
1,079
Sq Ft
$255/Sq Ft
Est. Value
About This Home
This home is located at 2614 Via Los Altos, Carrollton, TX 75006 and is currently estimated at $274,859, approximately $254 per square foot. 2614 Via Los Altos is a home located in Dallas County with nearby schools including Country Place Elementary School, Ted Polk Middle School, and Smith High School.
Ownership History
Date
Name
Owned For
Owner Type
Purchase Details
Closed on
Apr 9, 2010
Sold by
Robinson William Davis
Bought by
Frink Beth
Current Estimated Value
Home Financials for this Owner
Home Financials are based on the most recent Mortgage that was taken out on this home.
Original Mortgage
$100,152
Outstanding Balance
$68,335
Interest Rate
5.5%
Mortgage Type
FHA
Estimated Equity
$206,524
Purchase Details
Closed on
Aug 13, 2001
Sold by
Street Anne Marie and Street Warren Richard
Bought by
Robinson William Davis
Home Financials for this Owner
Home Financials are based on the most recent Mortgage that was taken out on this home.
Original Mortgage
$73,420
Interest Rate
7.14%
Mortgage Type
FHA
Purchase Details
Closed on
Jul 28, 1995
Sold by
Covey Teresa Gail Price and Covey Joe G
Bought by
Fisher Anne Marie
Home Financials for this Owner
Home Financials are based on the most recent Mortgage that was taken out on this home.
Original Mortgage
$60,080
Interest Rate
7.51%
Create a Home Valuation Report for This Property
The Home Valuation Report is an in-depth analysis detailing your home's value as well as a comparison with similar homes in the area
Home Values in the Area
Average Home Value in this Area
Purchase History
| Date | Buyer | Sale Price | Title Company |
|---|---|---|---|
| Frink Beth | -- | Rtt | |
| Robinson William Davis | -- | -- | |
| Fisher Anne Marie | -- | -- |
Source: Public Records
Mortgage History
| Date | Status | Borrower | Loan Amount |
|---|---|---|---|
| Open | Frink Beth | $100,152 | |
| Previous Owner | Robinson William Davis | $73,420 | |
| Previous Owner | Fisher Anne Marie | $60,080 |
Source: Public Records
Tax History Compared to Growth
Tax History
| Year | Tax Paid | Tax Assessment Tax Assessment Total Assessment is a certain percentage of the fair market value that is determined by local assessors to be the total taxable value of land and additions on the property. | Land | Improvement |
|---|---|---|---|---|
| 2025 | $2,771 | $319,460 | $49,500 | $269,960 |
| 2024 | $2,771 | $283,290 | $45,000 | $238,290 |
| 2023 | $2,771 | $283,290 | $45,000 | $238,290 |
| 2022 | $5,536 | $243,350 | $45,000 | $198,350 |
| 2021 | $4,014 | $167,250 | $45,000 | $122,250 |
| 2020 | $3,883 | $156,460 | $45,000 | $111,460 |
| 2019 | $3,819 | $145,670 | $35,000 | $110,670 |
| 2018 | $3,557 | $134,880 | $28,000 | $106,880 |
| 2017 | $2,774 | $104,660 | $28,000 | $76,660 |
| 2016 | $2,574 | $97,110 | $18,000 | $79,110 |
| 2015 | $1,813 | $97,110 | $18,000 | $79,110 |
| 2014 | $1,813 | $86,320 | $14,000 | $72,320 |
Source: Public Records
Map
Nearby Homes
- 2001 Via Sevilla
- 2107 Via Balboa
- 2621 Via Cordova
- 2633 Via Cordova
- 2637 Via Cordova
- 2518 Via Avenida
- 2109 Via Del Plata
- 2701 N Surrey Dr
- 2518 Brooke Trail
- 2708 Heather Glen Ct
- 2709 Heather Glen Ct
- 2524 Rosebud Ct
- 2709 Quail Ridge Dr
- 2711 N Surrey Dr
- 2706 Peach Tree Dr
- 2622 Winterlake Dr
- 2505 Fountain Cove
- 2721 Fallcreek Dr
- 2620 Carmel Dr
- 2719 N Surrey Dr
- 2616 Via Los Altos
- 2612 Via Los Altos
- 2610 Via Los Altos
- 2001 Via Bravo
- 2608 Via Los Altos
- 2003 Via Bravo
- 2606 Via Los Altos
- 2622 Via Los Altos
- 2000 Via Bravo
- 2002 Via Miramonte
- 2005 Via Bravo
- 2604 Via Los Altos
- 2624 Via Los Altos
- 2002 Via Bravo
- 2004 Via Miramonte
- 2001 Via Miramonte
- 2004 Via Bravo
- 2007 Via Bravo
- 2602 Via Los Altos
- 2001 Via Sonoma