NOT LISTED FOR SALE

26141 Raintree Ct Channahon, IL 60410

Estimated Value: $395,000 - $411,000

3 Beds
3 Baths
1,815 Sq Ft
$221/Sq Ft Est. Value

Last Sold November 19, 2021

Last sale price $320,000 $176 Per Sq Ft

Est. 26% increase in value since last sale

Current estimated payment $2,950/month

About This Home

As of November 2021

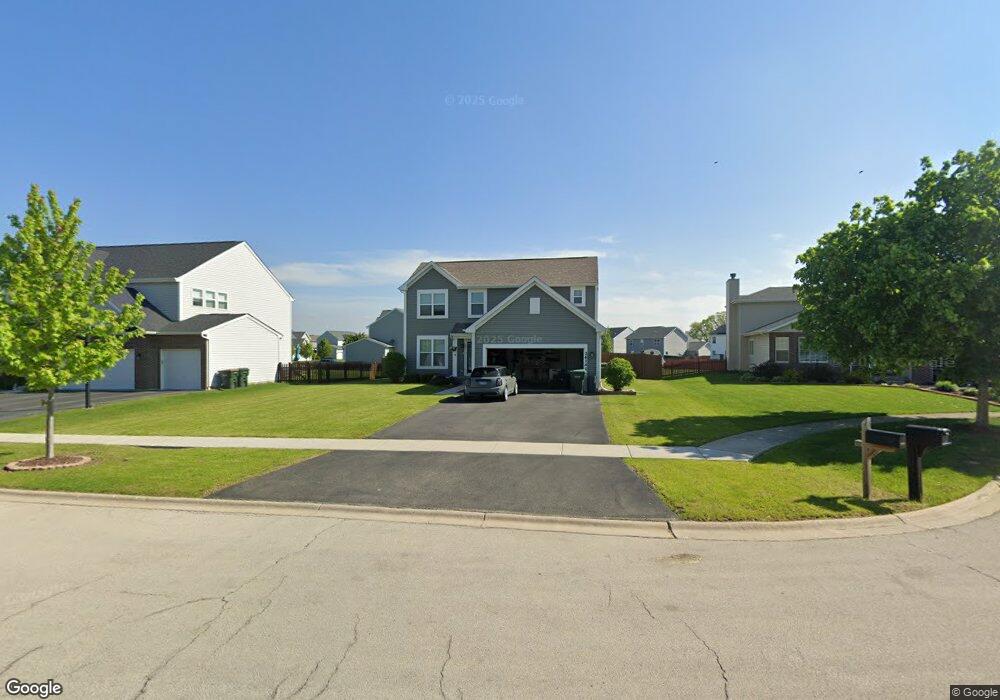
Practically brand new 3 BR, 2 Full and 1 Half bath home in Hunters Crossing is available to be your new home! The backyard has a very large poured concrete patio along with a privacy fence that were put in August of 2020. The full unfinished basement gives you plenty of options to use for your best capability. This is better than buying new since so many things are already done for you! Come see it today before it's gone!

Ownership History

Date Name Owned For Owner Type

Purchase Details

Closed on
Apr 25, 2019
Sold by
M/I Homes Of Chicago Llc
Bought by
Miller Ashley S and Babich Joseph M
Current Estimated Value
$401,694

Home Financials for this Owner

Home Financials are based on the most recent Mortgage that was taken out on this home.
Original Mortgage
$203,992
Outstanding Balance
$178,239
Interest Rate
4%
Mortgage Type
Construction
Estimated Equity
$223,455

Purchase Details

Closed on
Feb 1, 2017
Sold by
Heartland Bank & Trust Company
Bought by
Mi Homes Of Chicago Llc
Source: Public Records

Range of Values:

Collateral Analytics

Collateral Analytics Collateral Analytics AVMs (Automated Valuation Model) employ a number of statistical approaches combined with neighborhood-specific comparable selection guarantees the most up-to-date and precise valuations.

Not Available

Collateral Analytics does not have data for the current month. Please view the chart for historical values.

ICE

ICE Mortgage Technology ICE Mortgage Technology’s AVM (Automated Valuation Model) is a state-of-the-art online residential property valuation tool that provides a quick and accurate estimate of the value of almost any home in the U.S.

Not Available

ICE Mortgage Technology does not have data for the current month. Please view the chart for historical values.

First American

First American First American Data & Analytics’ next-generation AVM combines unrivaled data assets with a blended ensemble of valuation models to produce highly accurate, reliable valuations you can trust.

Not Available

First American does not have data for the current month. Please view the chart for historical values.

Quantarium

Quantarium Quantarium’s valuation service, repeatedly proven the industry’s most accurate and comprehensive, is supercharged with a self-learning and auto-tuning AI engine that continually becomes smarter and more accurate as it processes daily inputs from the industry’s leading RE data lake.

Not Available

Quantarium does not have data for the current month. Please view the chart for historical values.

Average Value
Not Available
List Price
Sold Price
Create a Home Valuation Report for This Property
The Home Valuation Report is an in-depth analysis detailing your home's value as well as a comparison with similar homes in the area

Home Values in the Area

Source: Public Records

Average Home Value in this Area


Source: Public Records

Purchase History

Date Buyer Sale Price Title Company
Miller Ashley S $254,990 First American Title
Mi Homes Of Chicago Llc $2,112,000 Greater Illinois Title Compa
Source: Public Records

Mortgage History

Date Status Borrower Loan Amount
Open Miller Ashley S $203,992
Source: Public Records

Property History

Date Event Price List to Sale Price per Sq Ft Prior Sale
11/19/2021 11/19/21 Sold $320,000 0.0% $176 / Sq Ft View Prior Sale
10/14/2021 10/14/21 Pending -- -- --
10/09/2021 10/09/21 For Sale $320,000 -- $176 / Sq Ft

Tax History Compared to Growth

Source: Public Records

Tax History

Year Tax Paid Tax Assessment Tax Assessment Total Assessment is a certain percentage of the fair market value that is determined by local assessors to be the total taxable value of land and additions on the property. Land Improvement
2024 $9,540 $118,747 $21,672 $97,075
2023 $8,674 $107,968 $19,754 $88,214
2022 $7,583 $100,388 $18,367 $82,021
2021 $7,216 $95,028 $17,386 $77,642
2020 $7,045 $90,903 $16,631 $74,272
2019 $4,999 $62,989 $15,399 $47,590
2018 $441 $5,076 $5,076 $0
2017 $144 $1,628 $1,628 $0
2016 $136 $1,528 $1,528 $0
2015 $118 $1,389 $1,389 $0
2014 $108 $1,312 $1,312 $0
2013 $111 $1,330 $1,330 $0
Source: Public Records

Agents Affiliated with this Home

  • Section Image
  • Section Image
See All Agents

Map