Estimated Value: $243,429 - $280,000
3
Beds
2
Baths
1,268
Sq Ft
$206/Sq Ft
Est. Value
About This Home
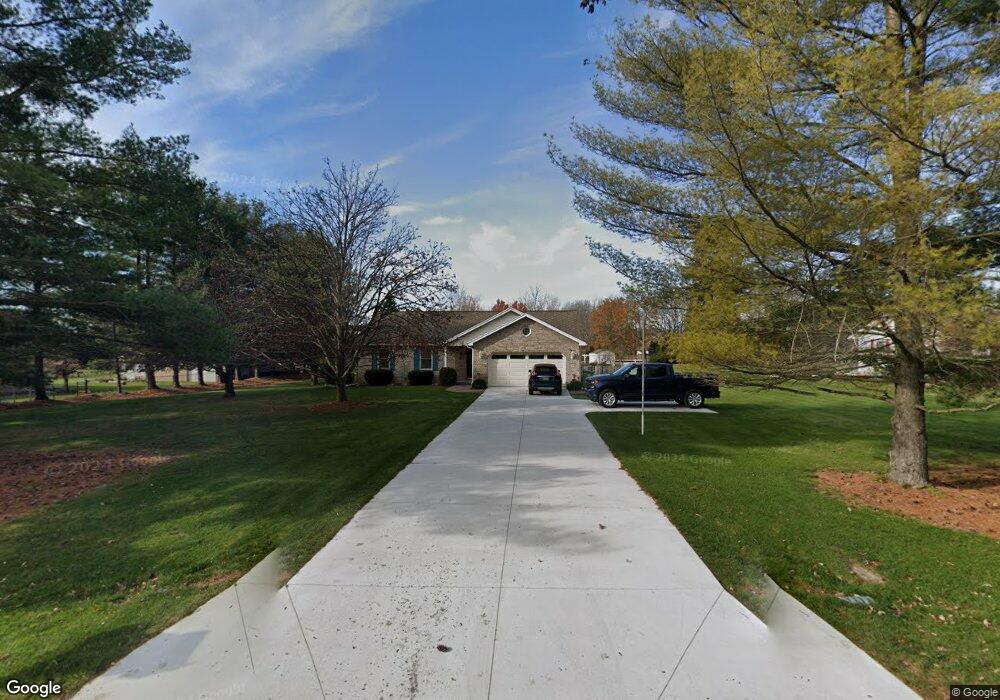
This home is located at 2615 College Rd, Holt, MI 48842 and is currently estimated at $260,857, approximately $205 per square foot. 2615 College Rd is a home located in Ingham County with nearby schools including Elliott Elementary School, Hope Middle School, and Holt Junior High School.
Ownership History
Date
Name
Owned For
Owner Type
Purchase Details
Closed on
Feb 15, 2021
Sold by
Wagner Todd R and Linda S Bowlin Protecton Trust
Bought by
Wagner Todd R and Cizauskan Jerome J
Current Estimated Value
Purchase Details
Closed on
May 17, 2017
Sold by
Bowlin Linda S
Bought by
Bowlin Linda S and Linda S Bowlin Protection Trust
Purchase Details
Closed on
Oct 14, 2016
Sold by
Cizauskas Jerome J
Bought by
Jerome J Cizauskas Protection Trust
Purchase Details
Closed on
Jul 12, 1999
Sold by
Donna L Battige Trust
Bought by
Bowlin Linda S and Cizauskas Jerome J
Home Financials for this Owner
Home Financials are based on the most recent Mortgage that was taken out on this home.
Original Mortgage
$85,900
Outstanding Balance
$23,814
Interest Rate
7.43%
Mortgage Type
Purchase Money Mortgage
Estimated Equity
$237,043
Purchase Details
Closed on
Jul 17, 1998
Sold by
Battige Donna L
Bought by
Battige, Donna L Trust
Create a Home Valuation Report for This Property
The Home Valuation Report is an in-depth analysis detailing your home's value as well as a comparison with similar homes in the area
Home Values in the Area
Average Home Value in this Area
Purchase History
| Date | Buyer | Sale Price | Title Company |
|---|---|---|---|
| Wagner Todd R | -- | None Available | |
| Bowlin Linda S | -- | None Available | |
| Jerome J Cizauskas Protection Trust | -- | None Available | |
| Bowlin Linda S | -- | None Available | |
| Cizauska Jerome J | -- | None Available | |
| Bowlin Linda S | $145,900 | Midstate Title Company | |
| Battige, Donna L Trust | -- | -- | |
| Donna L Battige Trust | -- | -- |
Source: Public Records
Mortgage History
| Date | Status | Borrower | Loan Amount |
|---|---|---|---|
| Open | Bowlin Linda S | $85,900 |
Source: Public Records
Tax History
| Year | Tax Paid | Tax Assessment Tax Assessment Total Assessment is a certain percentage of the fair market value that is determined by local assessors to be the total taxable value of land and additions on the property. | Land | Improvement |
|---|---|---|---|---|
| 2025 | $3,760 | $114,600 | $12,500 | $102,100 |
| 2024 | $9 | $102,600 | $12,500 | $90,100 |
| 2023 | $3,507 | $86,400 | $12,500 | $73,900 |
| 2022 | $4,646 | $80,800 | $12,500 | $68,300 |
| 2021 | $3,312 | $77,900 | $12,500 | $65,400 |
| 2020 | $3,334 | $74,100 | $12,500 | $61,600 |
| 2019 | $3,274 | $67,600 | $12,500 | $55,100 |
| 2018 | $3,256 | $60,900 | $11,100 | $49,800 |
| 2017 | $2,938 | $60,900 | $11,100 | $49,800 |
| 2016 | $2,902 | $60,000 | $11,100 | $48,900 |
| 2015 | $2,848 | $59,500 | $22,226 | $37,274 |
| 2014 | $2,848 | $57,700 | $27,073 | $30,627 |
Source: Public Records
Map
Nearby Homes
- 3680 Bayou Place
- 0 Dell Rd Unit 290382
- 2792 Dellridge Dr
- 3215 Sandhill Rd
- 3860 Knotwood Dr
- 3930 Camperdown Dr
- 4029 N Pine Dell Dr
- 3990 Camperdown Dr
- 2650 Navigator Ln
- 4094 Sebring Dr
- 4106 Sebring Dr
- 2617 Navigator Ln
- 2545 Hummingbird Ln
- 2635 Navigator Ln
- 2611 Navigator
- 2645 Navigator Ln
- 2655 Navigator Ln
- 2612 Navigator Ln
- 4118 Sebring Dr
- 2668 Maritime Dr
- 2625 College Rd
- 2610 Sorority Ln
- 2600 Sorority Ln
- 2622 Sorority Ln
- 2631 College Rd
- 2606 College Rd
- 2634 Sorority Ln
- 2616 College Rd
- 2624 College Rd
- 2590 Sorority Ln
- 3510 Laureate Dr
- 3520 Laureate Dr
- 2596 College Rd
- 2646 Sorority Ln
- 2640 Sorority Ln
- 2625 Sorority Ln
- 2640 College Rd
- 2595 Sorority Ln
- 3530 Laureate Dr
Your Personal Tour Guide
Ask me questions while you tour the home.