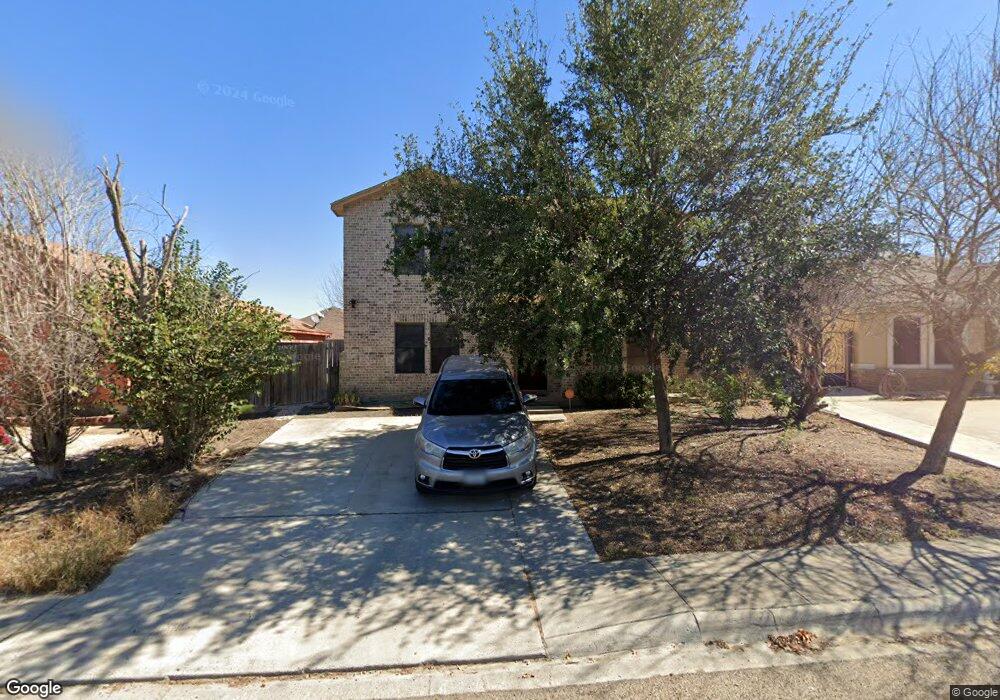
2615 Comal Loop Laredo, TX 78046
Estimated Value: $217,570 - $242,000
Studio
--
Bath
1,936
Sq Ft
$121/Sq Ft
Est. Value
About This Home
This home is located at 2615 Comal Loop, Laredo, TX 78046 and is currently estimated at $233,643, approximately $120 per square foot. 2615 Comal Loop is a home located in Webb County with nearby schools including Salinas Elementary School, United South Middle School, and United South High School.
Ownership History
Date
Name
Owned For
Owner Type
Purchase Details
Closed on
Apr 27, 2011
Sold by
Deutsche Bank National Trust Company
Bought by
Hernandez Ollivier Ariday N
Current Estimated Value
Home Financials for this Owner
Home Financials are based on the most recent Mortgage that was taken out on this home.
Original Mortgage
$89,911
Interest Rate
4.75%
Mortgage Type
FHA
Purchase Details
Closed on
Jan 4, 2011
Sold by
Butanda Juan and Butanda Melissa
Bought by
Deutsche Bank National Trust Company
Purchase Details
Closed on
May 14, 2009
Sold by
Villarreal Eva
Bought by
Villarreal Maria Ignacia
Purchase Details
Closed on
Dec 2, 2005
Sold by
Rjh Inc
Bought by
Butanda Juan and Butanda Melissa
Home Financials for this Owner
Home Financials are based on the most recent Mortgage that was taken out on this home.
Original Mortgage
$27,024
Interest Rate
6.29%
Mortgage Type
Stand Alone Second
Create a Home Valuation Report for This Property
The Home Valuation Report is an in-depth analysis detailing your home's value as well as a comparison with similar homes in the area
Purchase History
| Date | Buyer | Sale Price | Title Company |
|---|---|---|---|
| Hernandez Ollivier Ariday N | -- | Lsi Title Agency Inc | |
| Deutsche Bank National Trust Company | $122,081 | None Available | |
| Villarreal Maria Ignacia | -- | None Available | |
| Butanda Juan | -- | Neel Title Corp |
Source: Public Records
Mortgage History
| Date | Status | Borrower | Loan Amount |
|---|---|---|---|
| Previous Owner | Hernandez Ollivier Ariday N | $89,911 | |
| Previous Owner | Butanda Juan | $27,024 | |
| Previous Owner | Butanda Juan | $108,099 |
Source: Public Records
Tax History
| Year | Tax Paid | Tax Assessment Tax Assessment Total Assessment is a certain percentage of the fair market value that is determined by local assessors to be the total taxable value of land and additions on the property. | Land | Improvement |
|---|---|---|---|---|
| 2025 | $1,107 | $233,822 | $53,570 | $180,252 |
| 2024 | $1,107 | $217,999 | $53,570 | $164,429 |
| 2023 | $4,175 | $206,268 | $43,560 | $162,708 |
| 2022 | $4,338 | $187,520 | $43,560 | $143,960 |
| 2021 | $4,252 | $162,498 | $36,845 | $125,653 |
| 2020 | $3,924 | $149,720 | $36,850 | $112,870 |
| 2019 | $4,033 | $150,990 | $36,850 | $114,140 |
| 2018 | $3,770 | $139,010 | $36,740 | $102,270 |
| 2017 | $3,700 | $138,250 | $36,740 | $101,510 |
| 2016 | $3,597 | $134,400 | $29,760 | $104,640 |
Source: Public Records
Map
Nearby Homes
- 3919 Aguanieve Dr
- 3617 Nubes
- 3601 Nubes
- 5403 Brahman Ln
- 1924 Mexico Ave
- 3610 Niebla Dr
- 5409 Belmont Dr
- 3621 Fuente Ln
- 2103 Dorado Dr
- 3519 Aguanieve Dr
- 3420 Monclova Dr
- 3903 Aguascalientes
- 0 Cuatro Vientos Dr
- 322519 Wright Ranch
- 2613 Galloway Dr
- 4101 Toluca St
- 3208 Simmental Dr
- 5510 Belmont Dr
- 1108 Hebilla Ln
- 1126 Noyola Loop
- 2613 Comal Loop
- 2617 Comal Loop
- 2611 Comal Loop
- 2641 Comal Loop
- 2639 Comal Loop
- 2645 Comal Loop
- 2609 Comal Loop
- 2616 Comal Loop
- 2614 Comal Loop
- 2618 Comal Loop
- 2628 Comal Loop
- 2612 Comal Loop
- 2647 Comal Loop
- 2626 Comal Loop
- 2630 Comal Loop
- 2607 Comal Loop
- 2632 Comal Loop
- 2610 Comal Loop
- 2624 Comal Loop
- 2649 Comal Loop
Your Personal Tour Guide
Ask me questions while you tour the home.